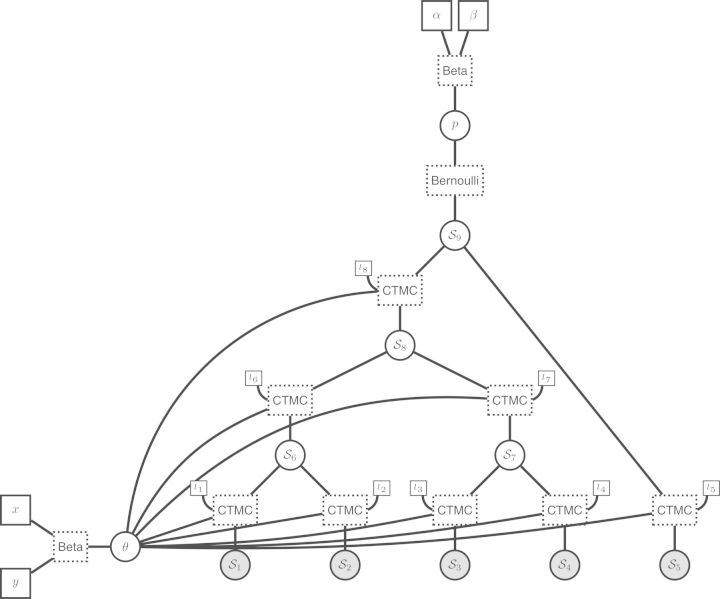
Figure 12.
A factor graph representing the binary character evolution model introduced in Figure 3. The factor graph additionally displays the probability distributions (the factors) as part of the model graph, for example, a Beta distribution, Bernoulli distribution and continuous time Markov chain (CTMC). A factor graph is always an undirected graph showing only the relationship between the variables and the corresponding distributions.

