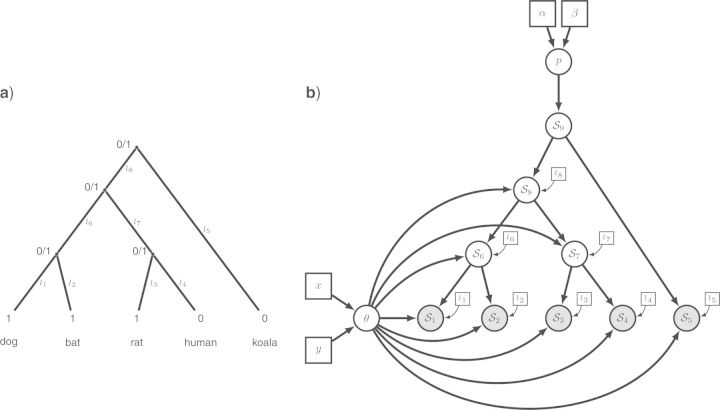
Figure 3.
The evolution of a single binary character represented as a phylogenetic graphical model. a) The phylogenetic relationships of the five mammalian species. The observed state of the character (1: presence or 0: absence of the baculum) is given for each species. Other states at the internal nodes represent the unknown ancestral state. The branches of the tree (1,…,8) are labeled and assigned a fixed length (l1,…,l8). b) The corresponding graphical model, in which the species tree topology is still evident. We represent the state for each node with generic notation: S1 is the presence/absence state for node 1. The clamped nodes, in grey, indicate observed states, whereas unobserved states for ancestral species are in white. Constant nodes indicate fixed/known branch lengths. Under this model, the state for the root of the tree (S9) is drawn from a Bernoulli distribution with probability p. A Beta prior is assigned to the parameter of the Bernoulli distribution so that p∼Beta(α,β), where the parameters of the Beta distribution are constant nodes and assigned fixed values. The states of the nodes descended from the root of the tree (S1,…,S8) are dependent on the equilibrium frequency parameter (θ) and their respective branch lengths (constant nodes l1,…,l8). A second Beta distribution is applied as a prior on the parameter θ, where θ∼Beta(x,y).

