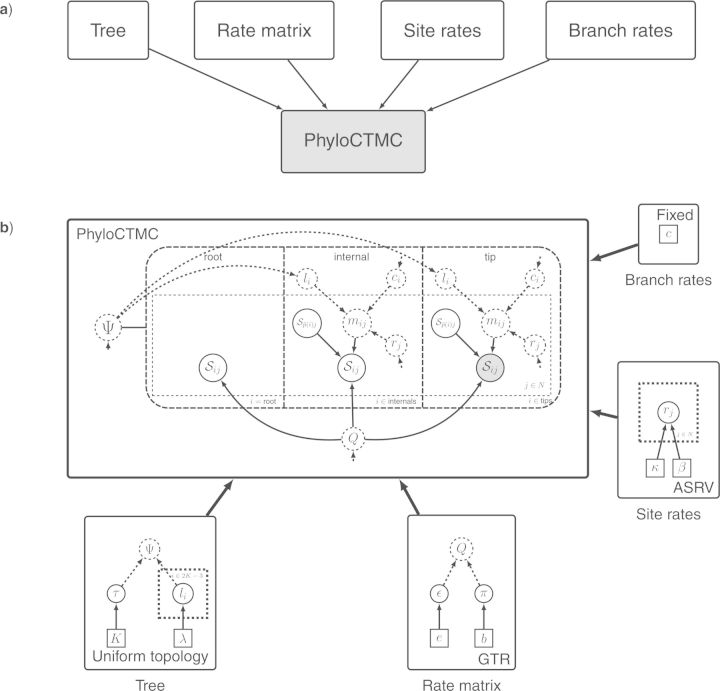
Figure 8.
The graphical model of Figure 6, a GTR + Γ model, represented in modular form. a) The model is broken into five different modules: Tree, Rate matrix, Site rates, Branch rates and PhyloCTMC (Phylogenetic Continuous Time Markov Chain). By representing all modules in collapsed form, we obtain a compact high-level visualization of the model. Arrows point from upstream to downstream components in the complete model graph. b) By expanding the modules to expose the model subgraphs they contain, we obtain a detailed description of the model. Note that the four upstream modules (Tree, Rate matrix, Site rates, and Branch rates) are all named after the corresponding pivot variable. Also note that the symbols used for pivot variables are matched across connected modules, both by name and by plate or tree plate indices. Small arrows aid the search for pivot variables. The only new variable added here, mij, is the deterministically computed rate multiplier for branch i and site j, obtained by multiplying the branch length li with the branch rate ci and the site rate rj. Details of the modules are provided in the text.

