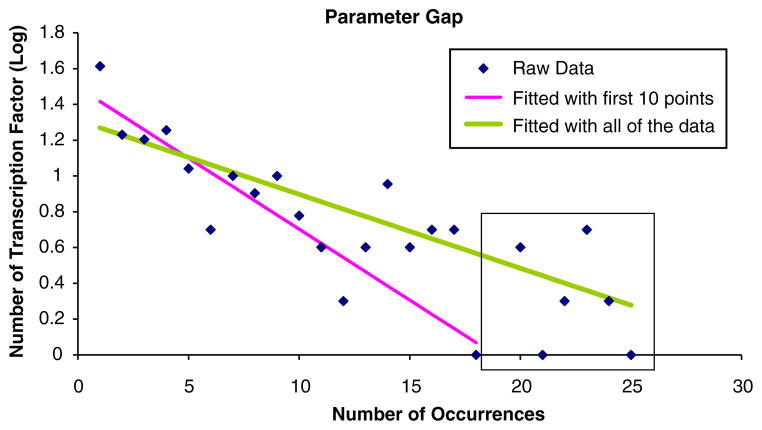
FIGURE 7.
This illustrates the gap caused by fitting all of the data, and fitting only the first ten data points. The number of informative transcription factors should be less than the expected value if the exponential distribution is estimated from all of the data, and greater than the expected value of the exponential distribution accounts only for the first ten points. R2 value in with the first 10 data points is 0.74 and 0.69 when all of the data was used.

