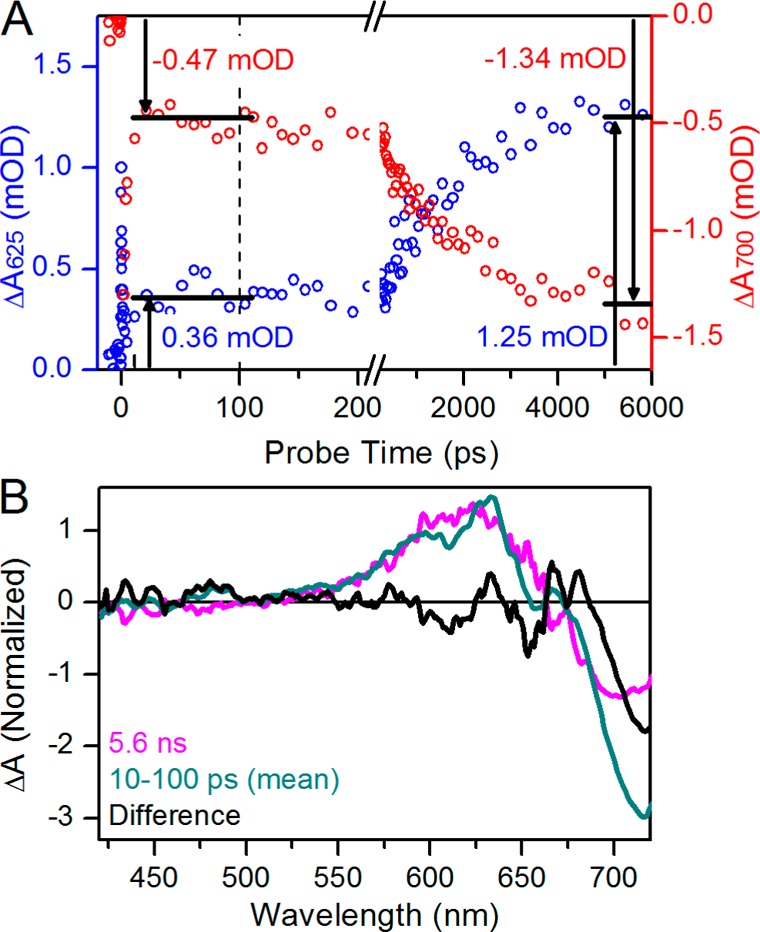
Figure 5.

(A) Comparison of amplitudes between earlier and later probe time ranges at 625 and 700 nm probe wavelengths (blue and red and left and right y-axes, respectively). Horizontal bars indicate plateaus; the earlier time was averaged from 10 to 100 ps, and the later time was averaged from 4 to 6 ns. (B) Comparison between 5.6 ns and 10–100 ps spectra (magenta and dark cyan, respectively). The 10–100 ps spectra are averaged and scaled 5-fold for review. The difference between them is obtained (black).
