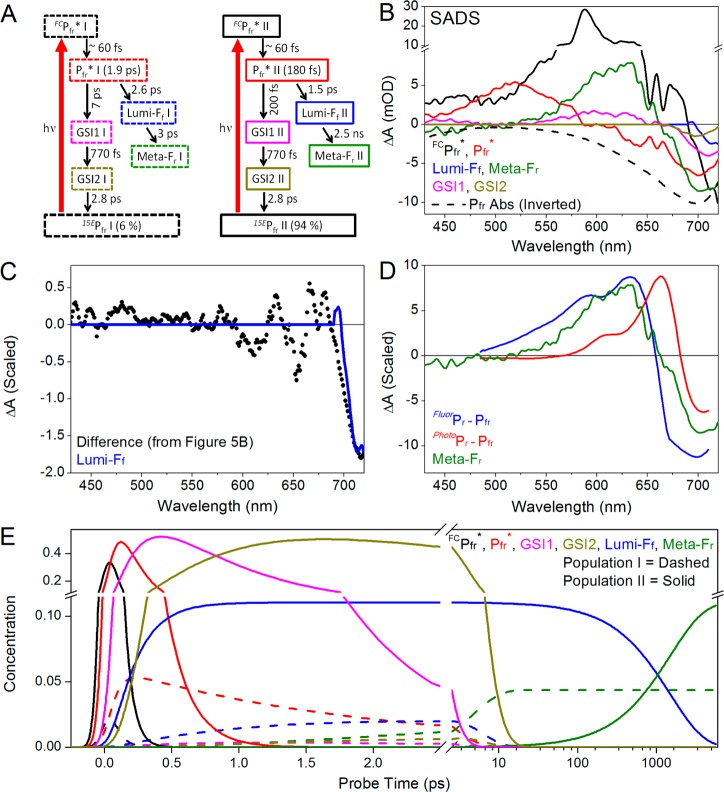
Figure 8.
Global analysis of Pfr to Pr dynamics. (A) Proposed target model with two Pfr subpopulations (Pfr I and Pfr II). Each spectral species is represented in a box, and its apparent time constant is given in parentheses. (B) Estimated SADS of the target model. FCPfr*, Pfr*, GSI1, GSI2, Lumi-Ff, and Meta-Fr from populations I and II have identical respective SADS. (C) Comparison between Lumi-Ff SADS and the difference spectra in Figure 5B. (D) Comparison between Meta-Fr SADS (green) and FluorPr – Pfr and PhotoPr – Pfr difference spectra (blue and red, respectively). (E) Concentration profile of each constituent population. The color scheme is the same as that in panel A, with population I represented by the dashed curves.

