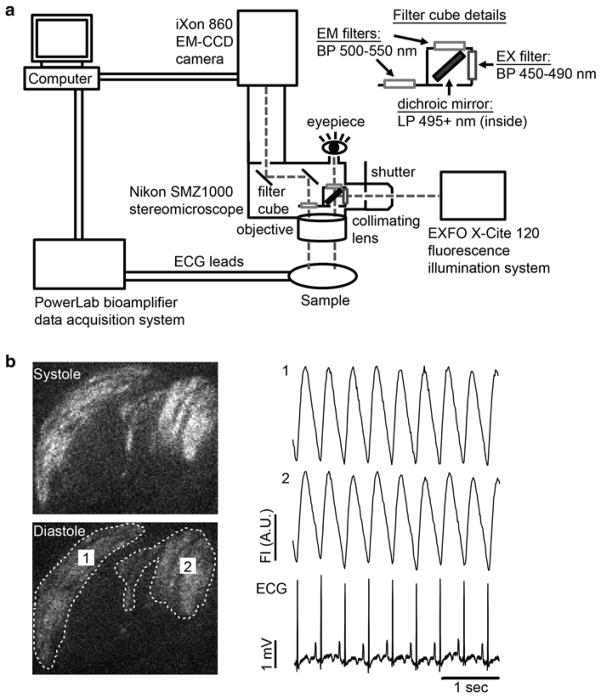
Fig. 3.
Schematic diagram of our GCaMP3 imaging system and representative recordings. (a) Our intravital imaging system includes a high-speed, high-sensitivity CCD camera (Andor iXon 860 EM-CCD) mounted on an epifluorescence stereomicroscope (Nikon SMZ1000). GCaMP3 is excited with a 450–490 band-pass filter, and its emission passes through a 500–550 nm band-pass filter before detection. The host electrocardiogram (ECG) is simultaneously recorded using a bioamplifier and data acquisition board (ADInstruments PowerLab system). Fluorescence and ECG signals are digitized and fed to a computer for storage and off-line analysis. (b) Left: Representative still images of GCaMP3+ hESC-CM grafts during systole and diastole. Two graft regions of interest (ROIs) have been circled by the dotted line. Right: Representative GCaMP3 fluorescence traces for the aforementioned ROIs as well as the simultaneously acquired ECG. Note that, in this case, fluorescence transients in both graft ROIs occur in a 1:1 relationship with the host ECG, indicating reliable graft–host coupling

