
Figure 2.
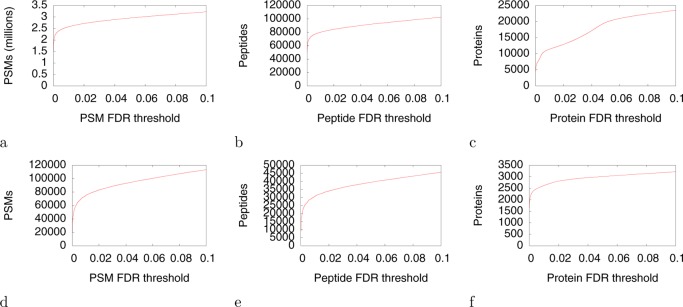
(a–c) We used Tide+Percolator to analyze 9 092 380 fragmentation spectra from 95 different human samples. The figure plots the number of spectra, peptides and proteins identified as a function of false discovery rate threshold. (d–f) Each panel plots, from Comet+Percolator analysis of 348 157 Plasmodium falciparum fragmentation spectra, the number of (respectively) spectra, peptides and proteins identified as a function of false discovery rate threshold. Total analysis time was 61.2 m (34.4 m for Comet and 26.8 m for Percolator). The number of proteins identified at 1% FDR (2618) by Comet+Percolator compares favorably with the published analysis (2767 proteins).