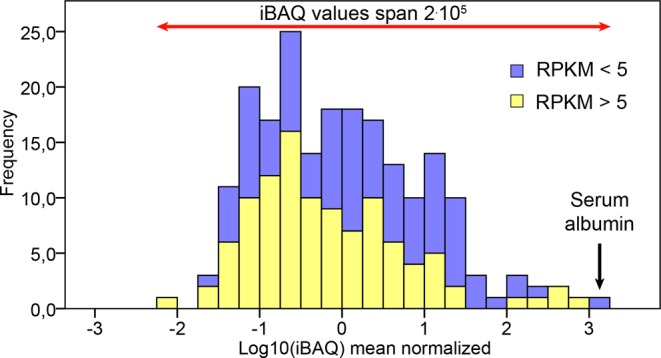
Figure 4.

Protein abundance distribution in synovial fluid. Frequency histogram of the calculated iBAQ values for all proteomics quantifiable proteins. The relative proportion of proteins whose mRNA transcript abundances were less than or greater than 5 RPKM in the synovial membrane transcriptome are colored blue and yellow, respectively.
