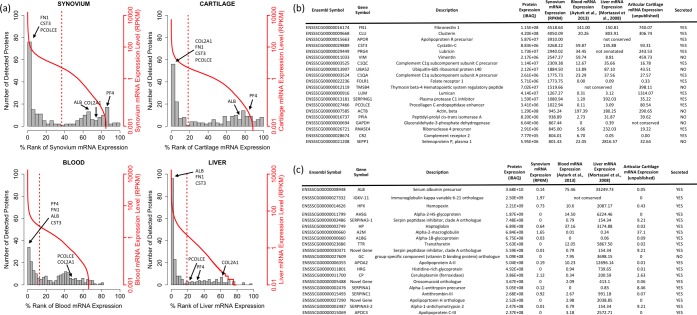
Figure 5.
mRNA expression levels associated with the proteins detected with MS. (a) Tissue-specific histograms indicating the number of detected proteins corresponding to each transcript. Genes are ranked based on mRNA expression along the x axis, and the secondary y axis (in red) indicates the expression levels in RPKM (in log scale). (b) Table indicating the top 20 mRNAs in synovium with detectable protein products in synovial fluid. Gene expression data derived from published and unpublished studies on tissues with potential influence on protein expression repertoire of serum and synovial fluid are also presented in the three columns on the right. Blood and liver mRNA data originate from mice, and articular cartilage mRNA data originate from humans. (c) Table indicating the top 20 proteins with no detectable mRNA expression in the synovium: note that the majority of mRNA species corresponding to these proteins are abundantly expressed by liver cells.

