
Figure 5.
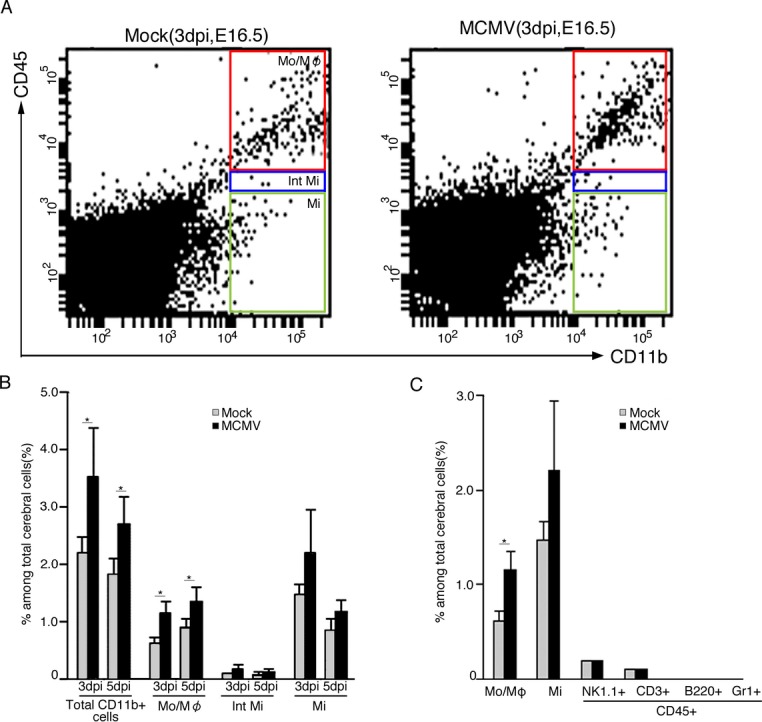
Flow cytometric analysis of cells in the fetal cerebra with meninges of mock- and MCMV-infected fetuses at E16.5 (3 dpi) and E18.5 (5 dpi). Total leukocytes were gated for CD45 expression and further characterized for CD11b, NK1.1 (NK cells), CD3 (T cells), B220 (B cells), and Gr1 (neutrophils). The analysis was performed in triplicate using a total of nine mock- and four MCMV-infected fetuses at each time point. (A) Representative flow cytometric plots separating monocyte/macrophage (CD45high/CD11b+, Mo/Mφ), intermediate microglia (CD45int/CD11b+, Int Mi), and microglia (CD45low/CD11b+, Mi) populations of mock- (left panel) or MCMV-infected (right panel) cerebra at E16.5 (3 dpi). (B) The percentages of total CD11b+ cells, Mo/Mφ, Int Mi, and Mi among the total cerebral cells of mock-infected or MCMV-infected fetuses at E16.5 (3 dpi) and E18.5 (5 dpi). Mean ± SEM of nine mock- and four MCMV-infected fetuses at E16.5 (3 dpi) and E18.5 (5 dpi) are shown. *P < 0.05 compared with mock-infected mice. (C) The percentages of Mo/Mφ, Mi, NK cells (CD45high/NK1.1high, NK1.1+), T cells (CD45high/CD3high, CD3+), B cells (CD45high/B220high, B220+), and neutrophils (CD45high/Gr1high, Gr1+) among the total cerebral cells of mock- or MCMV-infected fetuses at E16.5 (3 dpi). Mean ± SEM of nine mock- or four MCMV-infected fetuses. *P < 0.05 compared with mock-infected mice. MCMV, murine cytomegalovirus.