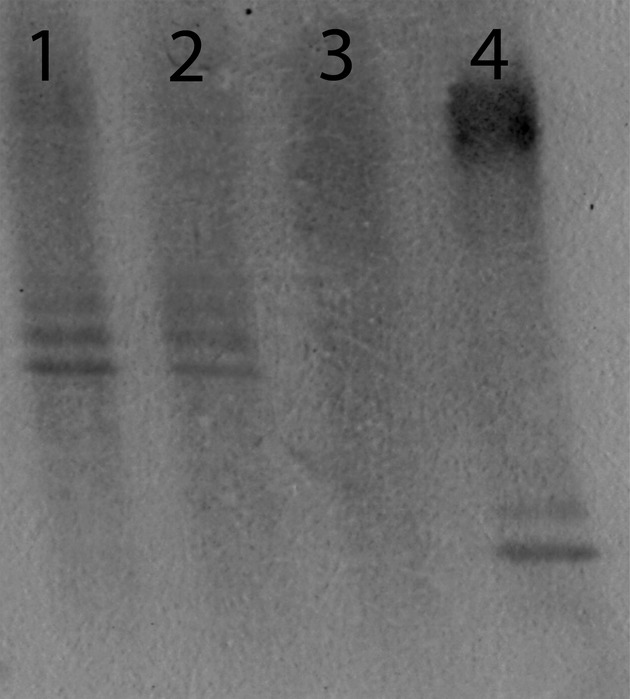
Figure 1.

Immunoblot staining for SAF virus-specific oligoclonal IgG bands in two multiple sclerosis (MS) patients. The figure shows paired serum and CSF oligoclonal IgG blots from two MS patients: lanes 1 (serum) and 2 (CSF) show a mirror pattern of SAF virus-specific IgG bands; lanes 3 (serum) and 4 (CSF) from a second MS patient show unique SAF virus-specific IgG bands in CSF only.
