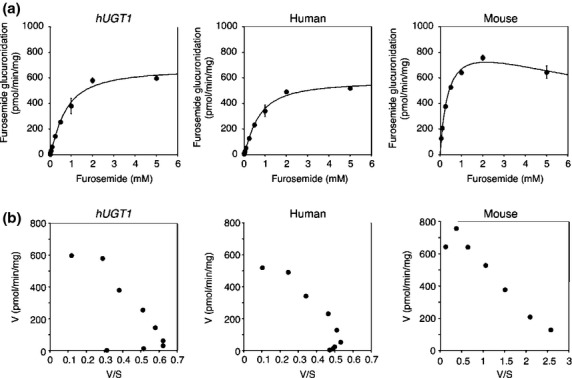
Figure 1.

Kinetic analyses of furosemide acyl-glucuronide formation in liver microsomes. The substrate concentration-velocity curves (A) and Eadie–Hofstee plots (B) of the furosemide glucuronide formation are shown. Pooled liver microsomes of hUGT1 mice, humans, and regular mice were incubated with 50 μmol/L to 5 mmol/L furosemide and 5 mmol/L UDP-glucuronic acid at 37°C for 30 min. In the substrate concentration-velocity curves, data are the means ± SD of three independent determinations. In the Eadie–Hofstee plots, each data point represents the mean of three independent experiments.
