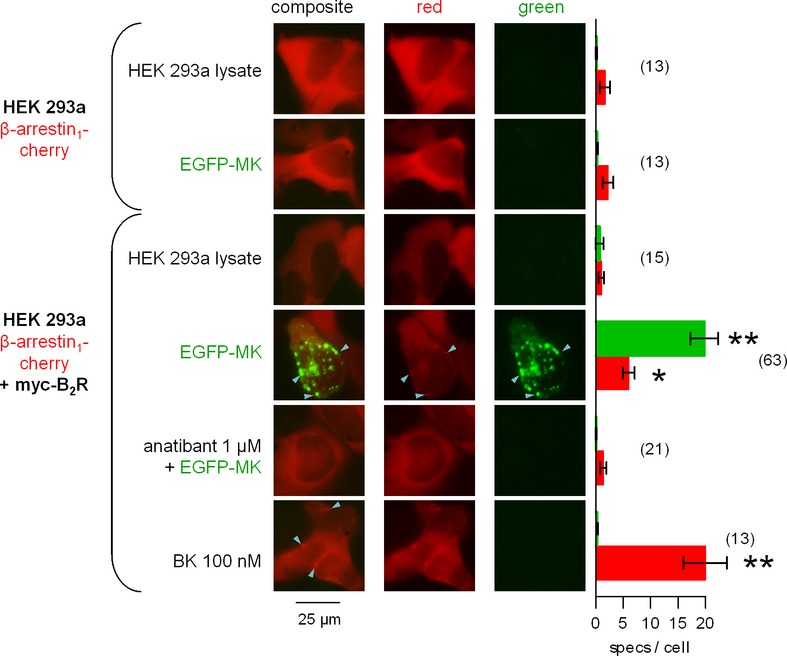
Figure 10.

Epifluorescence microscopy studies in cells coexpressing β-arrestin1-Cherry and, optionally, myc-B2R and stimulated for 30 min with the indicated agent. EGFP-MK, recovered from cell lysate, was diluted to a final concentration of 4.2 nmol/L for EGFP-MK (estimate based on an ELISA for GFP). Control HEK 293a cell lysate, used in equal proportion, was from cells transfected with the EGFP-C3 vector. Original magnification: 1000×. Only cells expressing the myc-B2R and stimulated with EGFP-MK exhibited green endocytic structures, and some were colocalized with condensed arrestin (arrowheads). BK stimulation also produced arrestin condensation, but without green labeling (arrowhead). Right: Number of intracellular condensed structures (“specs”) per cell for each of the green and red signals. Numbers between parentheses close to bars indicate the number of evaluated HEK 293a cells. The Kruskal–Wallis test indicated that the values were heterogenous for both the red and green signals (P < 0.001). The effect of stimulant treatment relative to control cells (receptor-expressing cells stimulated with EGFP, 3rd row) was evaluated using Dunn's multiple comparison test for each color. *P < 0.05; **P < 0.001.
