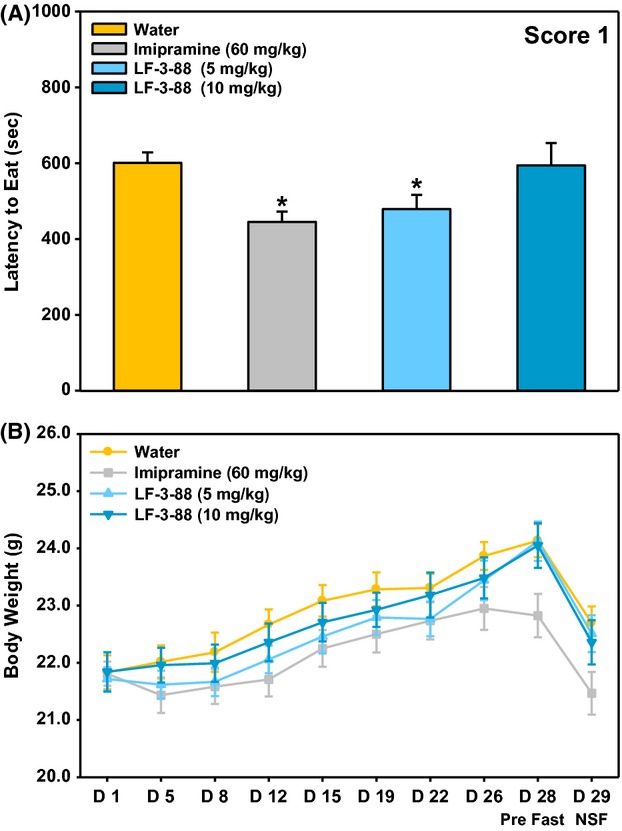
Figure 6.

(A) Mean latency to eat during the 15-min test as scored by the first blinded observer. Data are presented as mean ± SEM; ANOVAs: F(3, 42) = 3.9, P < 0.05. (B) Average body weight across the 29 days of treatment. Data are presented as mean ± SEM; ANOVAs: F(3, 44) = 1.3. *Fisher's PLSD posthoc test: *P < 0.05 versus vehicle. n = 11 12/group.
