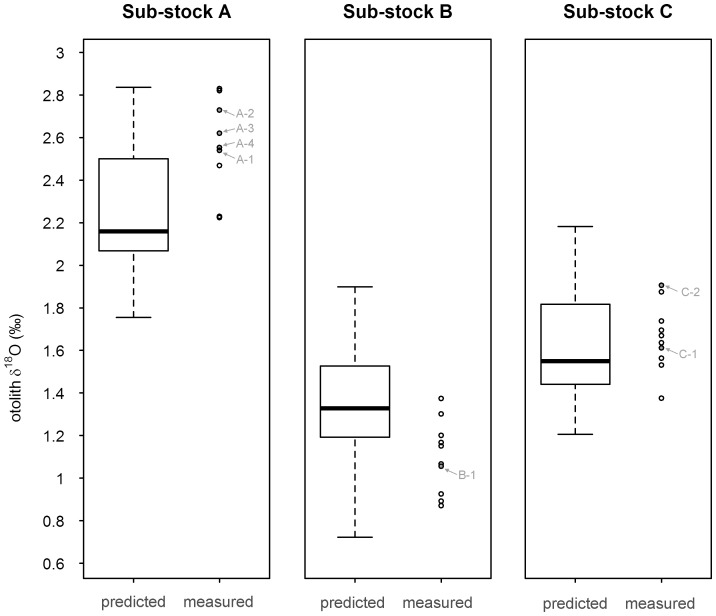
Figure 3. Overall annual otolith δ18O predictions per sub-stock.
Predicted annual δ18O values (in white), obtained by applying all 3 plausible otolith growth scenarios to the monthly δ18O derived from the stock-specific temperature and salinity conditions experienced (30,000 simulations), and corresponding measured annual δ18O values (circles) per sub-stock. In each boxplot, the box includes 50% of the data and the whiskers 100%, with the bold line within the box indicating the median. For each sub-stock, the individual otolith annual δ18O values of the fish returned with a full annual DST record (c.f. Table 1) are indicated in grey.

