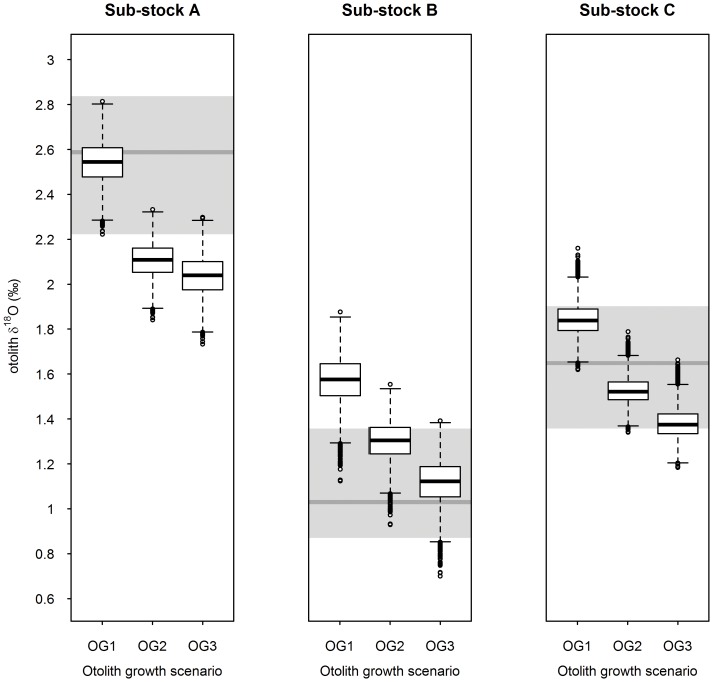
Figure 4. Annual otolith δ18O predictions per growth scenario for the 3 sub-stocks.
Predicted annual δ18O values (in white) were obtained by individually applying each of the 3 plausible otolith growth scenarios (OG1, OG2 and OG3) to monthly δ18O derived from the stock-specific temperature and salinity conditions experienced (10,000 simulations per scenario and sub-stock). In each case, the white box includes 50% of the data and the whiskers 99%, with the bold line within the box indicating the median and the circles the outlier values. For comparison, the full range of observed annual δ18O values is represented for each sub-stock (in grey, the bold line indicating the median).

