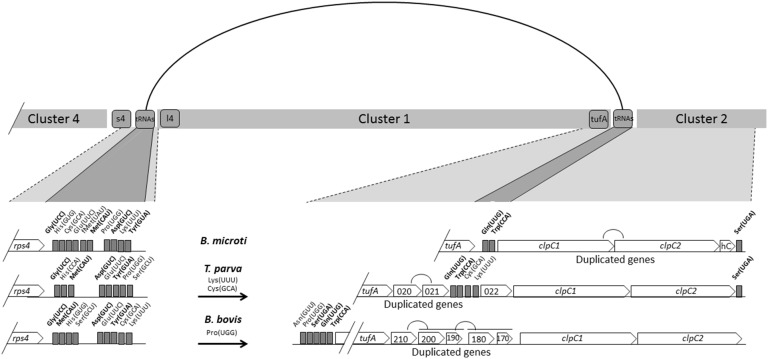
Figure 4. Schematic representation of the DNA regions surrounding cluster 1 in B. microti R1, B. bovis T2Bo and T. parva Mugaga.
A line connecting the two ends of Cluster 1 indicate possible recombination events accounting for differences found in the gene organization and size between apicoplast genomes of piroplasmida.

