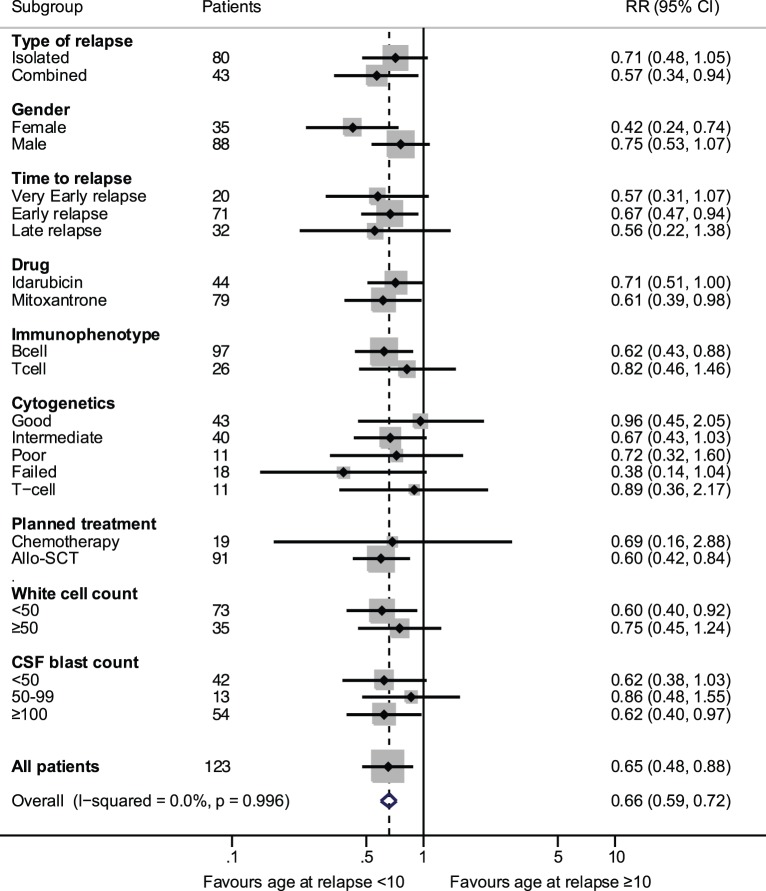
Figure 3. Age at relapse (<10 or ≥10 years) effect on progression-free survival by patient characteristics, from Cox models with interactions.
White cell count is the presenting count (×109/L) at first diagnosis. Relative risk ratios indicate that all subgroups show a poorer outcome in those ≥10 years, except good risk cytogenetics.

