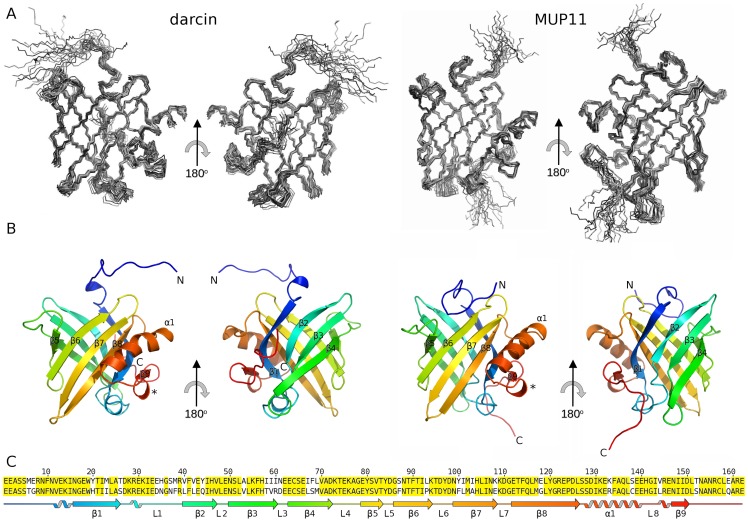
Figure 2. Solution structure of darcin (left) and MUP11 (right).
For clarity 180° representations are shown. (A) The ensembles each comprise 20 lowest-energy models. (B) For each ensemble a representative closest-to-mean structure was selected and shown as a cartoon representation of the structural elements. Marked in asterisk is the conserved 310-helix between α1 and β9. (C) Alignment of the primary sequence of darcin (top) with MUP11 (bottom) with conserved residues highlighted in yellow. The structural schematic for darcin is coloured to correlate with the colouring on the cartoon representation shown in (B), from N to C terminus as blue to red. In (C), the S-S bridge between C64 and C157 is indicated as black lines linking the two residues.

