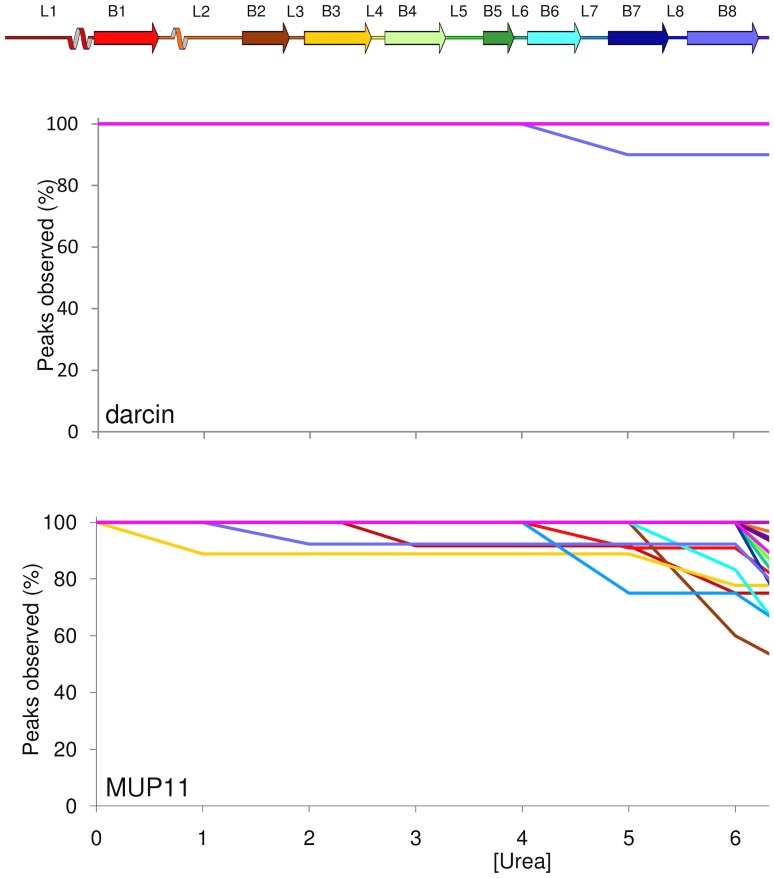
Figure 10. Urea denaturation of darcin and MUP11.
(Top) Schematic of secondary structures; loops (L), beta strands (B), and alpha helix (H) of darcin and MUP11. (Middle and Bottom) Plots of % of native backbone NH peaks observed at different urea concentrations for each secondary structure element in darcin (middle) and MUP11 (bottom); secondary structures are coloured coded as in the schematic. In darcin, the only region that is destabilised by urea is L8.

