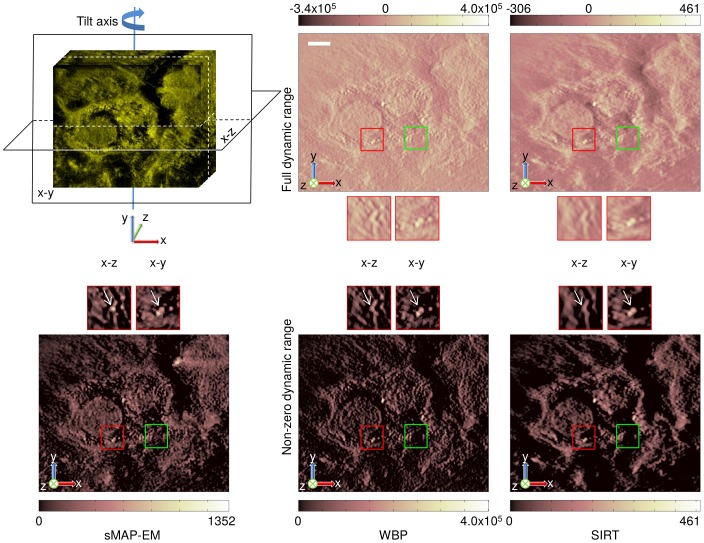
Figure 11. Comparison of orthogonal slices between sMAP-EM, WBP, and SIRT reconstructions from the experimental dataset.
(Top) The leftmost figure presents the location of the orthogonal x–y and x–z slices over the reconstructed volume. Full dynamic range of each slice is visualized with a pseudo-color. Two boxes below each image are zoomed-up views of red region of interest (ROI) and its corresponding x-z plane. Green box in all slices indicate location of presumable MVB membrane breakage. (Bottom) Only non-negative pixel values of each slice are rendered with the same pseudo-color, by setting zero to all pixels originally having negative values. Two boxes above each image are zoomed-up views of the same ROI as in the images at the top, and associated x–z plane. sMAP-EM yields identical results for full and non-zero dynamic ranges while WBP and SIRT result in different visual impressions. sMAP-EM is superior to WBP and SIRT to reveal association of gold particles (white arrows). Scale bar 100nm.

