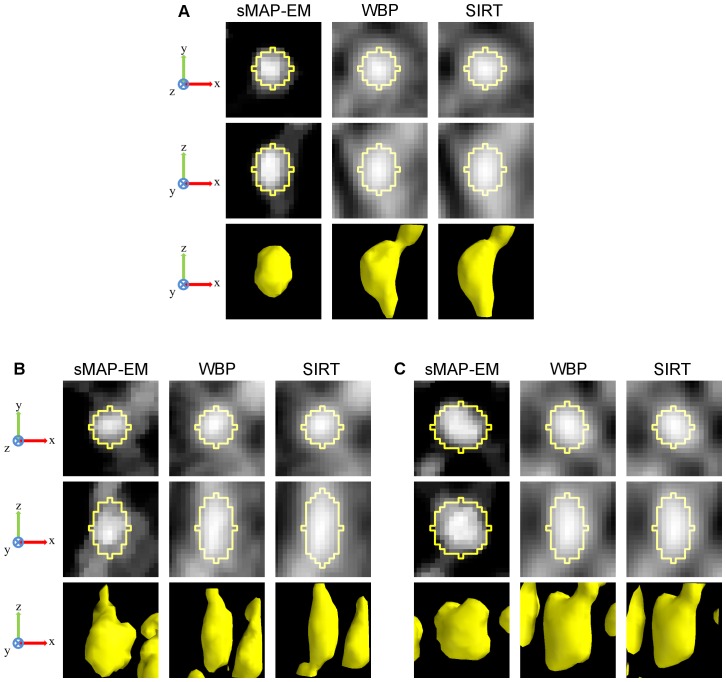
Figure 12. 3D fitted ellipsoids on gold particles in the experimental vesicle data reconstructions.
Subfigures A, B, and C present reconstructions for three different gold particles. For each gold particle, orthogonal x–y (top) and x–z (middle) slices through the center are given. Surface renderings (bottom) present overall shape of the reconstructed gold particles. Isosurface threshold value was selected experimentally for the best visualization. All images are in the same scale. The full dynamic range of each subimage was used for the best visualization. The z-direction resolution is better in the sMAP-EM reconstruction than in the WBP and SIRT reconstructions. Also the contrast is superior in the sMAP-EM reconstruction making further analysis simpler. The visual impression is supported by quantitative results presented in Table 2.

