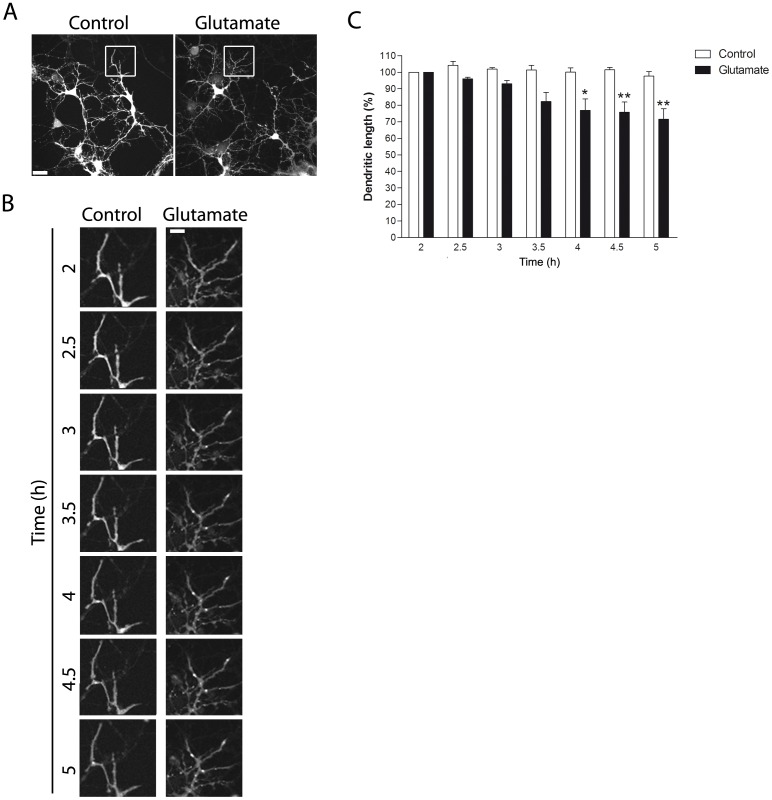
Figure 3. Glutamate-induced dendritic retraction visualized in CMFDA-stained neurons.
(A) Hippocampal neurons in culture (DIV 12–13) were stained with the CMFDA dye and then briefly exposed to 5 µM glutamate, and live-imaged 2 h later every 5 min for a 3 h-period. (B) Microphotographs of hippocampal living neurons in culture showing the progressive shortening of CMFDA positive neurites. (C) Quantification of dendritic shortening over time. Dendritic retraction is shown as percentage (%) of the dendritic length measured 2 h after glutamate exposure. Dendritic retraction is clearly evident 4 h after glutamate exposure. Results are expressed as mean values (±SEM). * P<0.05 and ** P<0.01 versus 100%, Student t test. Scale bars = 50 and 17 µm as magnification increases.

