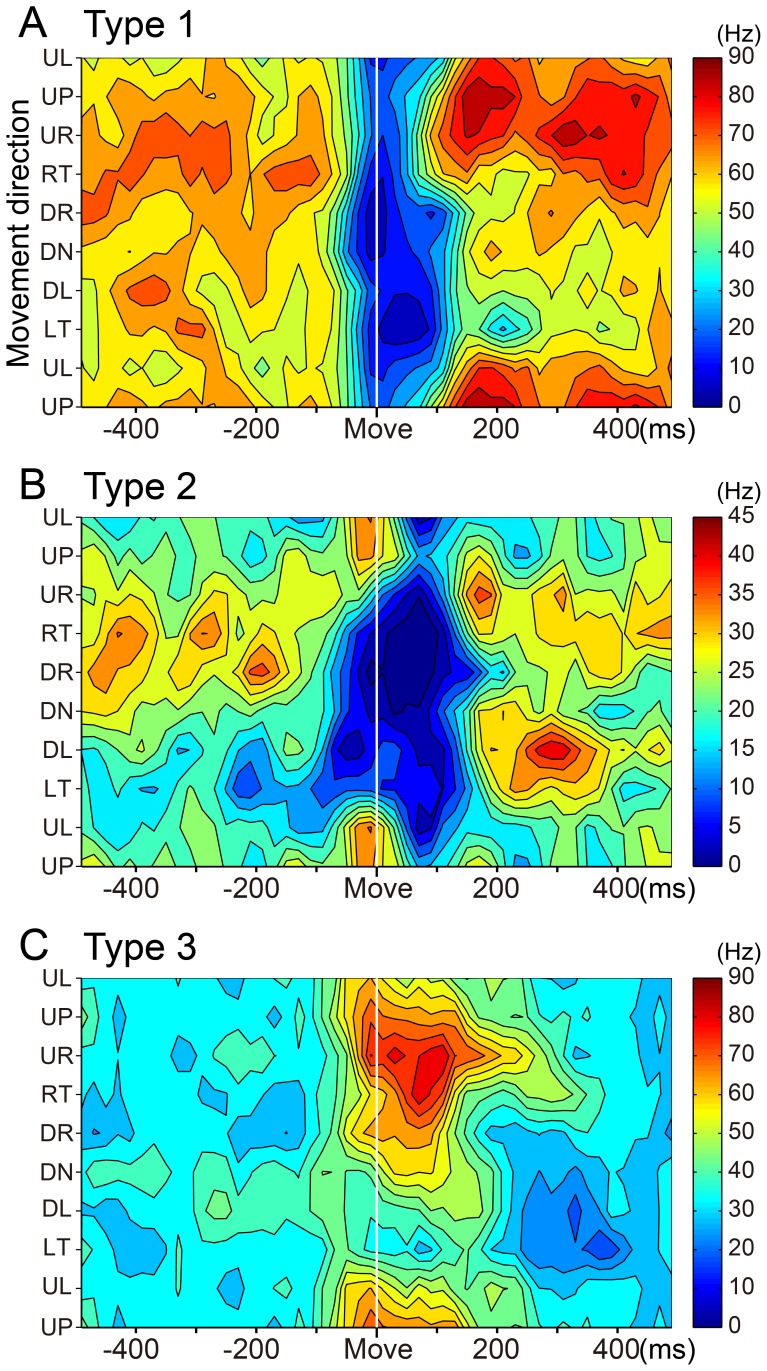
Figure 5. Contour plots of three types of SS activity.
Spatiotemporal maps of SS activity of type 1 (A), type 2 (B) and type 3 (C) PCs in relation to 8 movement directions (the same material illustrated in Figure 4). These plots were generated with MATLAB. Color code was adjusted according to the maximum firing rate in each PC.

