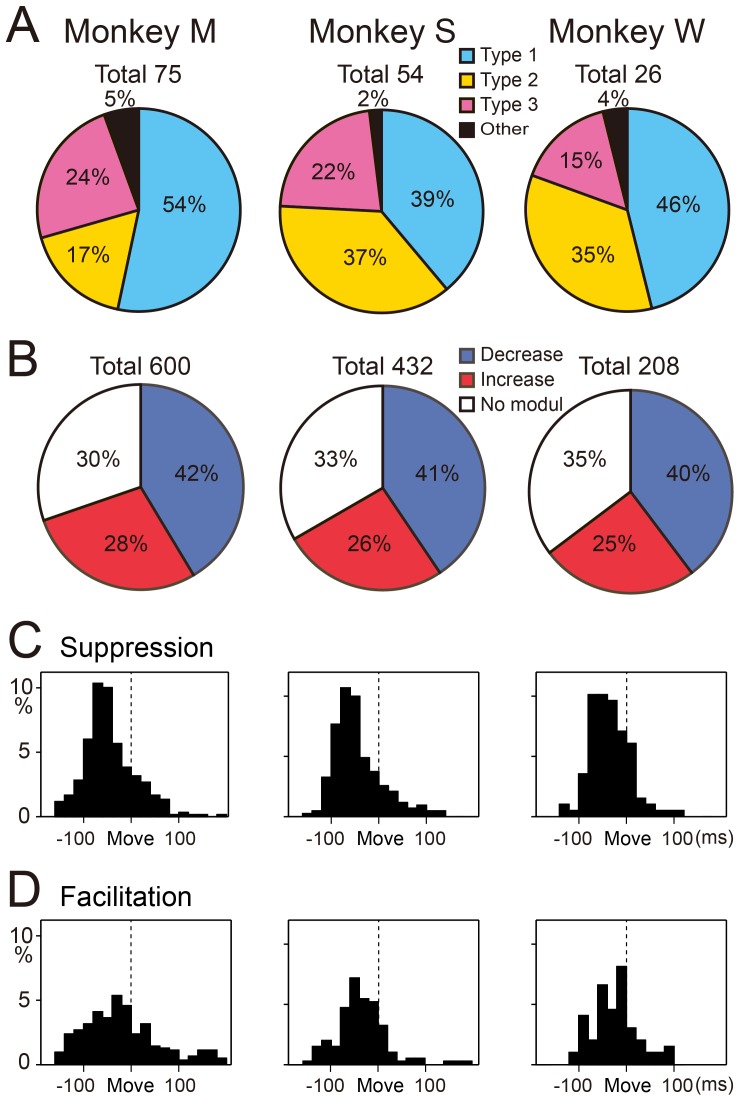
Figure 6. Percentages of the three types of PCs and distributions of onset latency for all suppressions and facilitations of SS activity.
A: Percentages of the three types of SS activity in the pronated posture in each animal. ‘Total’ at the top of each pie chart indicates the number of cells. B: Percentages of all facilitations and suppressions among the three types of modulation in the pronated posture in each animal. ‘Total’ at the top of each pie chart indicates the number of data sets (8 directions × number of cells). C and D: Distribution of onset latencies for all initial suppressions (C) and initial facilitations (D) recorded in the pronated posture for the three animals. Mean onset latencies were significantly earlier for the suppressions (C) than for the facilitations (D) (see Table 2).

