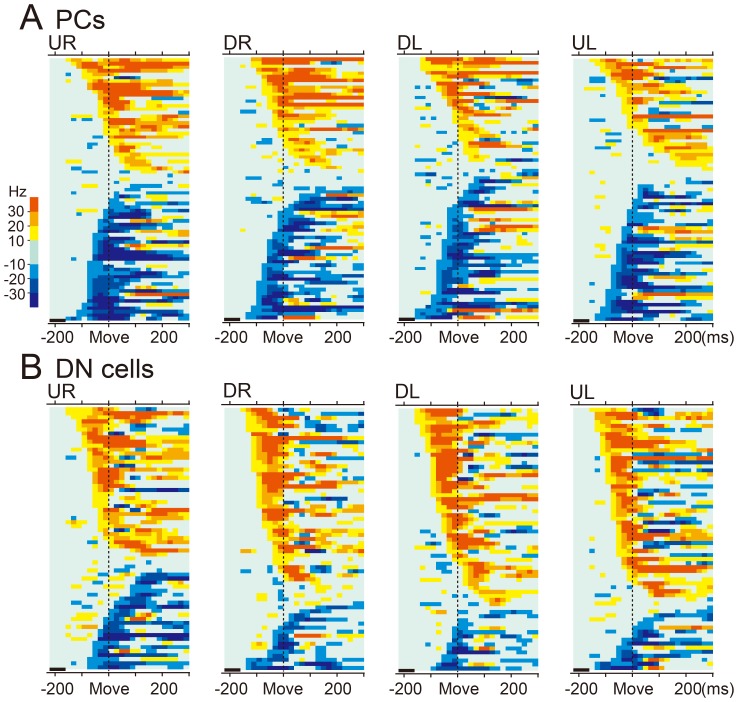
Figure 8. Modulation of population activity of PCs (A) and DN cells (B) in different movement directions.
Pseudo-color coded summaries of modulation of SS activity of all PCs (A) and activity of all DN cells (B) for four representative targets (UR: upper right, DR: down right, DL: down left, UL: upper left) in the pronated posture in monkey M (see Materials and Methods). Each colored rectangle represents the change in SS activity or DN cell activity relative to a reference period (220 to 160 ms before movement onset, indicated by thick black bar above the abscissa of each diagram). Light/dark blue tiles represent decreases in activity, while yellow/red tiles represent increases in activity. The PCs and DN cells were arranged from top to bottom based on direction of modulation (increase or decrease) and onset time of initial modulation.

