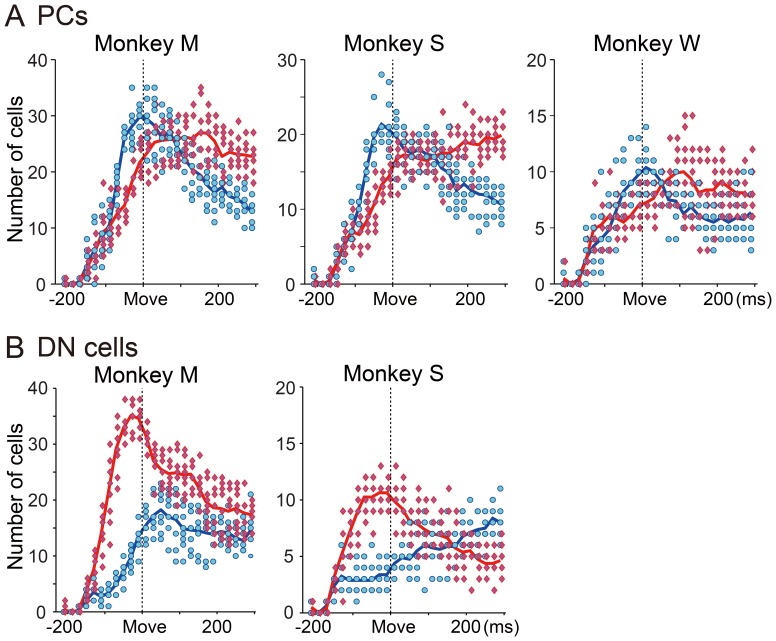
Figure 9. Temporal patterns of recruitment of all PCs and DN cells with facilitation or suppression of activity for eight different directions.
A: PCs. B: DN cells. In each time bin (20 ms), blue dots represent the number of PCs or DN cells with decreased activity, and red diamonds represent the number of PCs or DN cells with increased activity for eight different directions of movement in the pronated posture in each animal. Blue and red lines indicate mean numbers of blue dots and red diamonds in individual bins, respectively.

