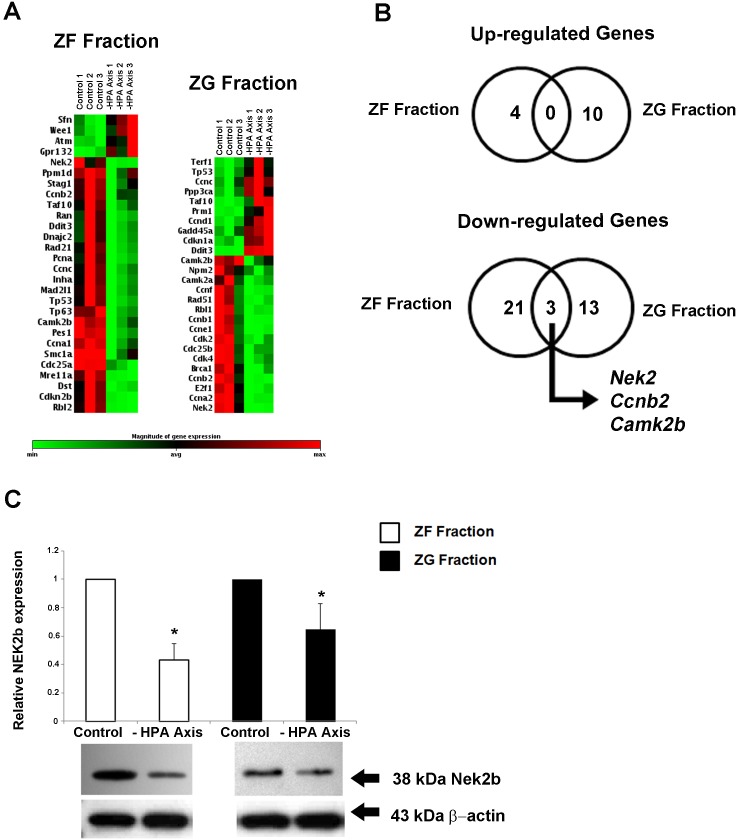
Figure 1. Clustergram showing the expression profile of significantly (p<0.05) altered genes related to the cell cycle in adrenal ZF fraction or ZG fraction after inhibition of the HPA axis with DEX for two days (50 µg/100 g BW) (A) Correlation of up- or down-regulated genes in ZF fraction and ZG fraction; genes regulated in both DEX and control treatments are presented in the figure intersection (B).
Analysis of Nek2b protein expression in adrenal ZF fraction and ZG fraction after inhibition of HPA axis with DEX (C). Adrenal glands were separated in two fractions (ZG and ZF), and total protein or total RNA, respectively, was extracted for the immunoblotting or PCR array analysis. Control animals received saline only (Control). *p<0.05, n = 3.

