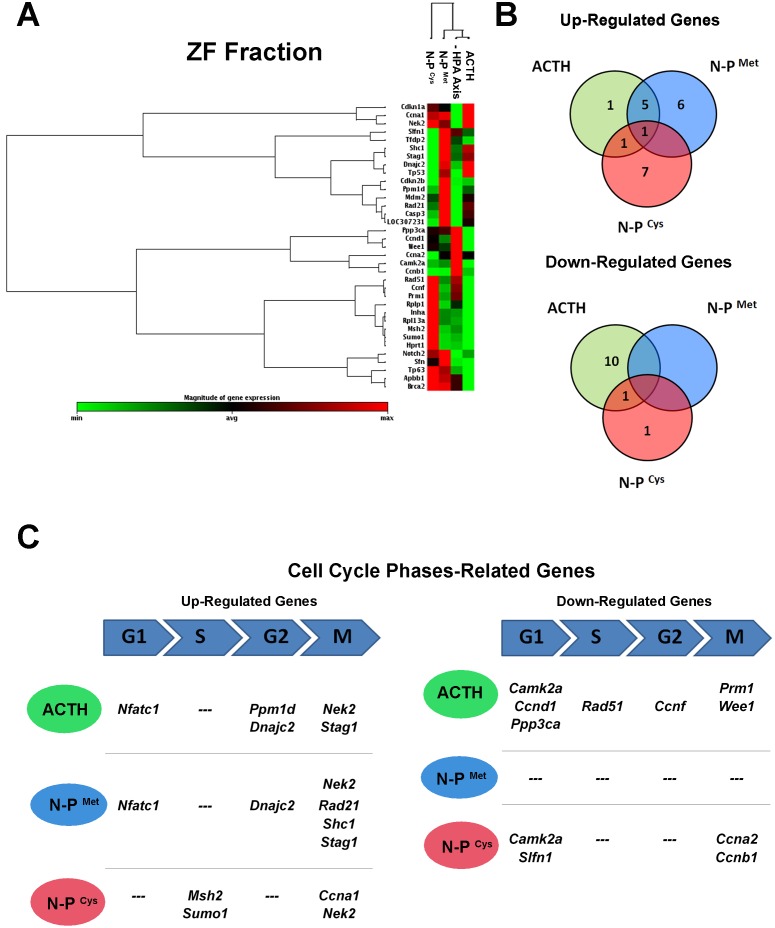
Figure 4. Results of the PCR array for cell cycle related genes in the ZF fraction.
Clustergram showing the expression profile of significantly (p<0.05) altered genes related to the cell cycle in the adrenal ZF fraction after inhibition of the HPA axis with DEX for two days (50 µg/100 g BW), followed by ACTH, N-POMCMet, or N-POMCCys treatments (A). Correlation of up- or down-regulated genes in the ZF fraction after treatments, showing the number of genes regulated by both treatments with POMC-derived peptides (B). Up- or down-regulated genes related to specific cell cycle phases after ACTH, N-POMCMet, or N-POMCCys treatments (C). G1: G1 phase and G1/S transition; G2: G2 phase; S: S phase and DNA replication; M: M phase.

