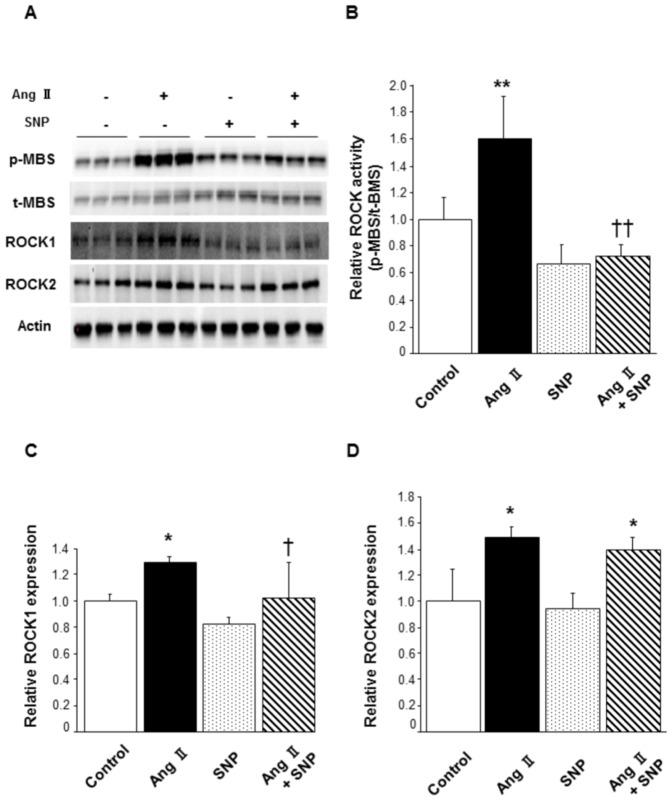
Figure 2. Effect of SNP on Ang II-induced ROCK activation in murine VSMCs.
Murine VSMCs were treated with a vehicle or SNP (40 µmol/L) for 3 hours and stimulated with saline or Ang II (40 µmol/L) for the last 1 hour. (A) Representative results of Western blot analysis for p-MBS, t-MBS, ROCK1, ROCK2, and actin. (B) Quantitative analysis of relative ROCK activity (p-MBS/t-MBS). (C) Quantitative analysis of relative ROCK1 expression. (D) Quantitative analysis of relative ROCK2 expression. n = 3 in each group. **P<0.01 compared to control; ††P<0.01 compared to Ang II; *P<0.05 compared to control; †P<0.05 compared to Ang II.

