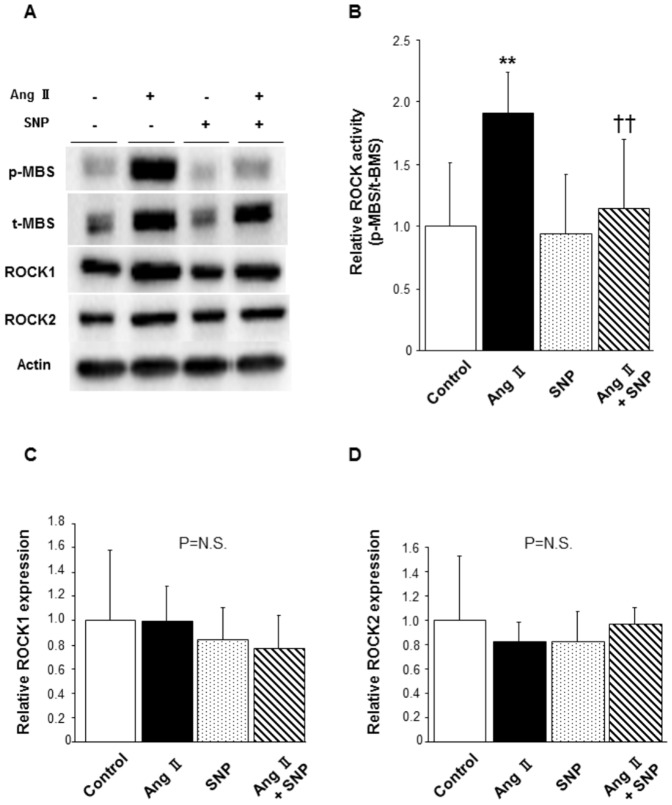
Figure 4. Effect of SNP on Ang II-induced ROCK activation in mouse aortas.
Mice were treated with saline or Ang II via implanted micro-osmotic pump infusion (2 mg/kg/day) and treated with saline or SNP via subcutaneous injection (5 mg/kg once a day) for 14 days. Increased blood pressures in Ang II-treated mice were normalized to levels similar to those in mice without Ang II treatment by hydralazine included in drinking water (20 mg/kg/day). (A) Representative results of Western blot analysis for p-MBS, t-MBS, ROCK1, ROCK2, and actin. (B) Quantitative analysis of relative ROCK activity (p-MBS/t-MBS). (C) Quantitative analysis of relative ROCK1 expression. (D) Quantitative analysis of relative ROCK2 expression. n = 5–11 in each group; **P<0.01 compared to control; ††P<0.01 compared to Ang II.

