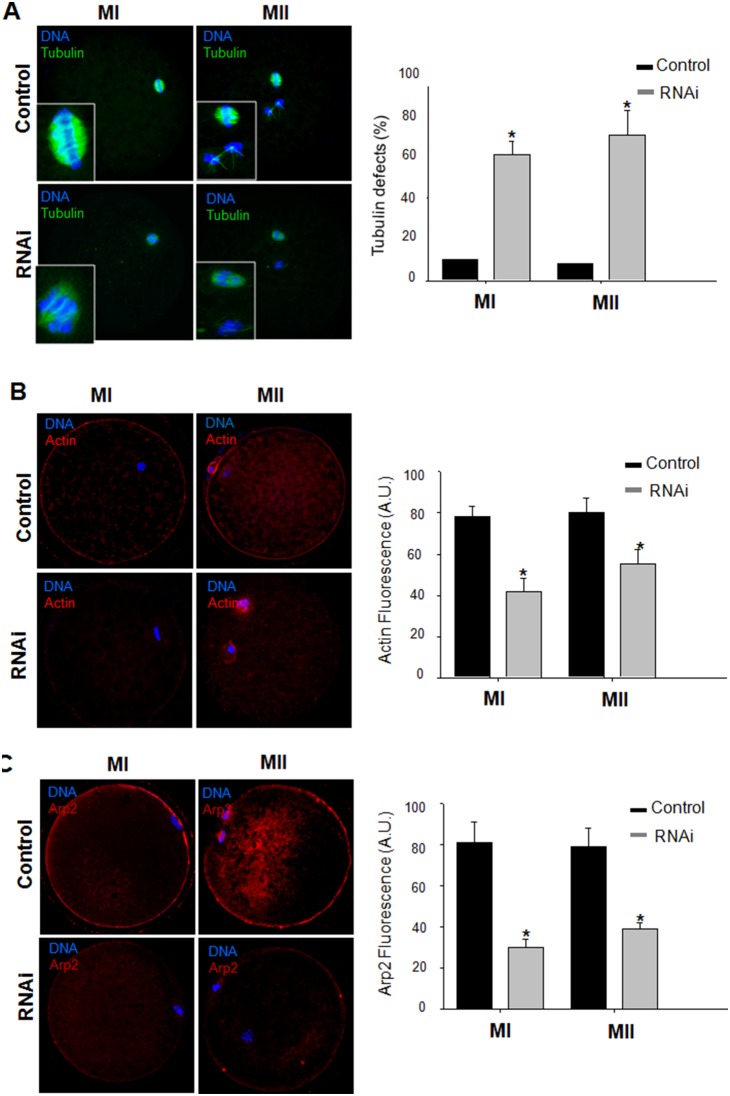
Figure 3. Actin, α-tubulin and Arp2 expression after knockdown of JMY in porcine oocytes.
A: Representative images of spindle defects in JMY knockdown oocytes at MI (20 h after culture) and MII (44 h after culture) stages are shown. Spindle was stained with anti-α-tubulin antibody (Green) and DNA was stained using Hoechest 33342 (Blue). B: Abnormal distribution of actin in control and dsRNA microinjection groups of oocytes at MI (20 h after culture) and MII (44 h after culture) stages. Actin(Red), DNA(Blue). Actin fluorescences were measured and quantitized (n = 6). Values represent mean ± s.e.m, *, p<0.05. C: Arp2 localization (left panel) and fluorescence intensity (right panel) in porcine oocytes at at MI (20 h after culture) and MII (44 h after culture) stages. Values represent mean ± s.e.m, *, p<0.05.

