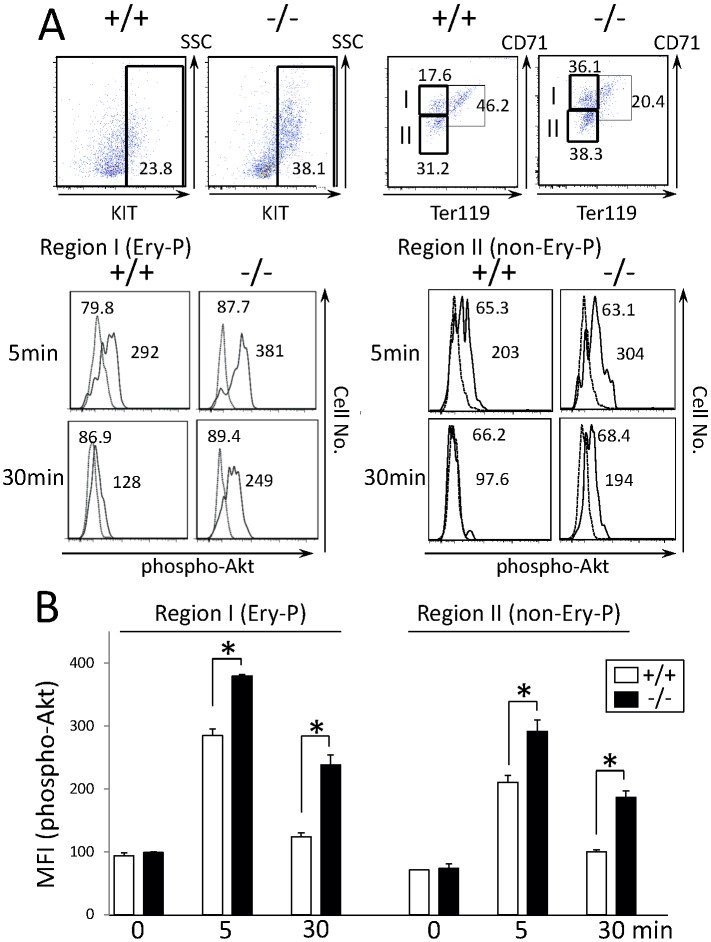
Figure 8. SCF-induced phosphorylation of Akt is enhanced and sustained in primary CALM −/− hematopoietic cells.
(A) KIT+ fractions were compared between WT and CALM −/− fetal liver cells by flow cytometry. After the cultures without growth factors for 16 h, cells were stimulated with 100 ng/ml SCF for the indicated times. After permeabilization, Akt phosphorylation was analyzed with the anti-phospho-Akt (Ser-473) Ab by gating KIT+CD71highTer119low erythroid progenitor (Ery-P) fraction (Region I) and KIT+CD71dimTer119low non-erythroid progenitor (non-Ery-P) fraction (Region II). Unstimulated samples appear as a broken line in the FACS plots. (B) Mean fluorescence intensity (MFI) of phosho-AKT was quantified with an analytical tool, and the results are shown as the mean±SD (n = 3, *p<0.05).

