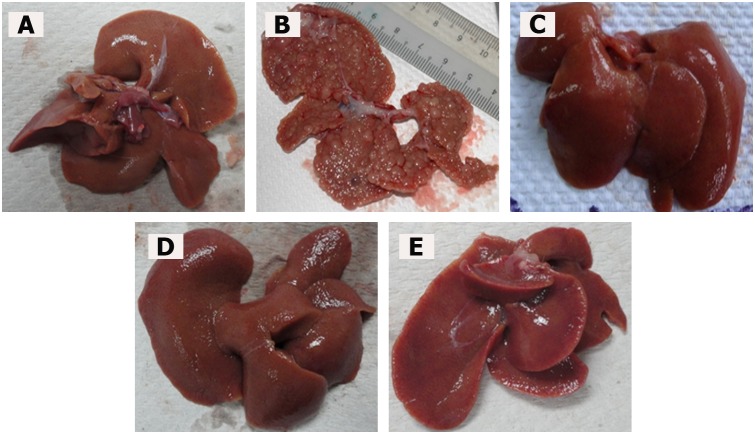
Figure 1. Macroscopic liver appearance.
(A) Normal control liver has regular smooth surface. (B) TAA control liver has rough nodular surface, with uniform distribution of micronodules (<0.3 cm) and macronodules (≥0.3 cm). (C) TAA+silymarin liver has normal smooth surface. (D) TAA+250 mg/kg ELAP liver has nearly smooth surface and few micronodules. (E) TAA+500 mg/kg ELAP liver has normal smooth surface and nearly normal anatomical shape and appearance. Livers shown are representative samples (n = 6/group).

