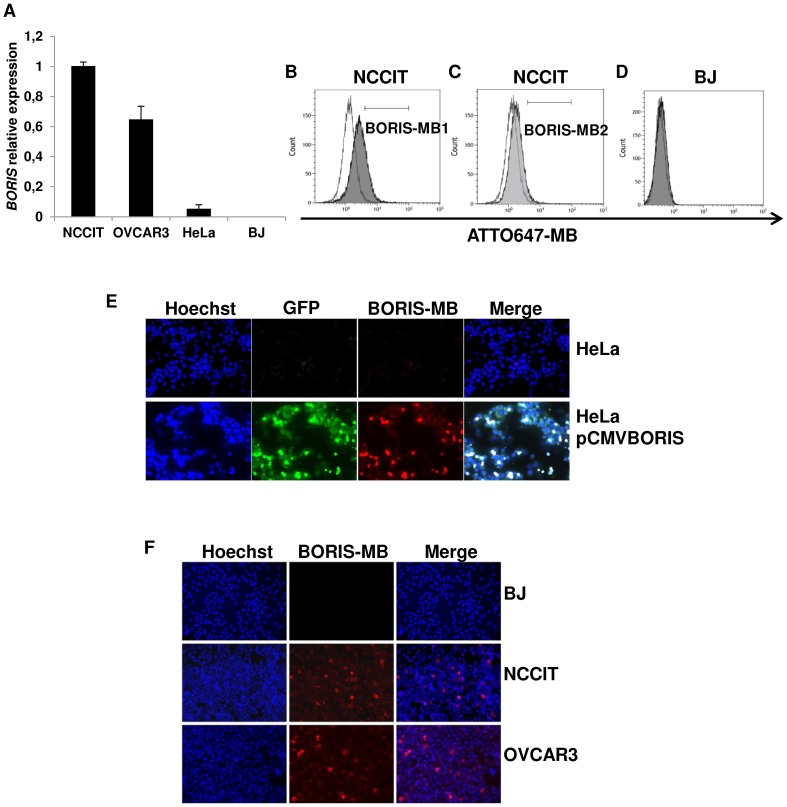
Figure 1. Detection of BORIS mRNA using BORIS-MB.
(A) BORIS expression in human cell lines. Total RNA were isolated from human tumoral cell lines: NCCIT (embryonic), OVCAR3 (ovarian), HeLa (cervical) and normal BJ (fibroblast) cells. mRNA levels of BORIS were analyzed by qRT-PCR. Results were normalized to GAPDH and related to NCCIT cells. BJ and NCCIT were considered as negative and positive controls, respectively. Error bars represent the mean ± SD of 3 independent experiments. (B) Fluorescent signals measured by flow cytometry of NCCIT cells transfected with ATTO647-BORIS-MB1 (dark grey peak) and with ATTO647-RANDOM-MB (white peak). (C) Fluorescent signals measured by flow cytometry of NCCIT cells transfected with ATTO647-BORIS-MB2 (weak grey peak) and with ATTO647-RANDOM-MB (white peak). (D) Fluorescent signals measured by flow cytometry of BJ cells treated with ATTO647-BORIS-MB1 (from here onward referred to BORIS-MB, grey peak) and with ATTO647-RANDOM-MB (white peak). (E) BORIS expression in HeLa cells using BORIS-MB. Representative images of HeLa cells transiently transfected with the BORIS expression vector, pCMV-BORIS (bottom) and non-transfected control cells (top), 20× magnification. (F) BORIS expression in human cell lines as detected using BORIS-MB. Representative images of BJ, NCCIT and OVCAR3 cells, 20× magnification. For fluorescence imaging, 1×10⁶ cells were incubated at 37°C for 1 hour in serum-free DMEM medium with Cy3-BORIS-MB (200 nM). Hoechst 33342 5 µg/mL was added during the last 10 min of incubation. Slides were analyzed by fluorescence microscopy.

