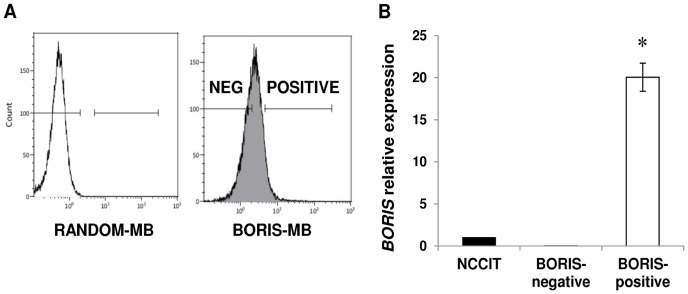
Figure 2. Isolation of BORIS-positive cells using BORIS-MB.
(A) NCCIT cells were transfected with ATTO647-RANDOM-MB (white peak) and ATTO647-BORIS-MB (grey peak). The two subpopulations, BORIS-negative and BORIS-positive cells were selected by comparing the fluorescent signal of RANDOM-MB to that of BORIS-MB. After exclusion of dead cells by PI staining, the two fractions were sorted. (B) BORIS expression of the isolated BORIS-negative and BORIS-positive fractions was analyzed by qRT-PCR. The results were normalized to GAPDH and related to non-sorted NCCIT cells. Error bars represent the mean ± SD of 3 independent experiments. Asterisk indicates statistically significant difference (p<0.05) between BORIS-positive and non-sorted cells.

