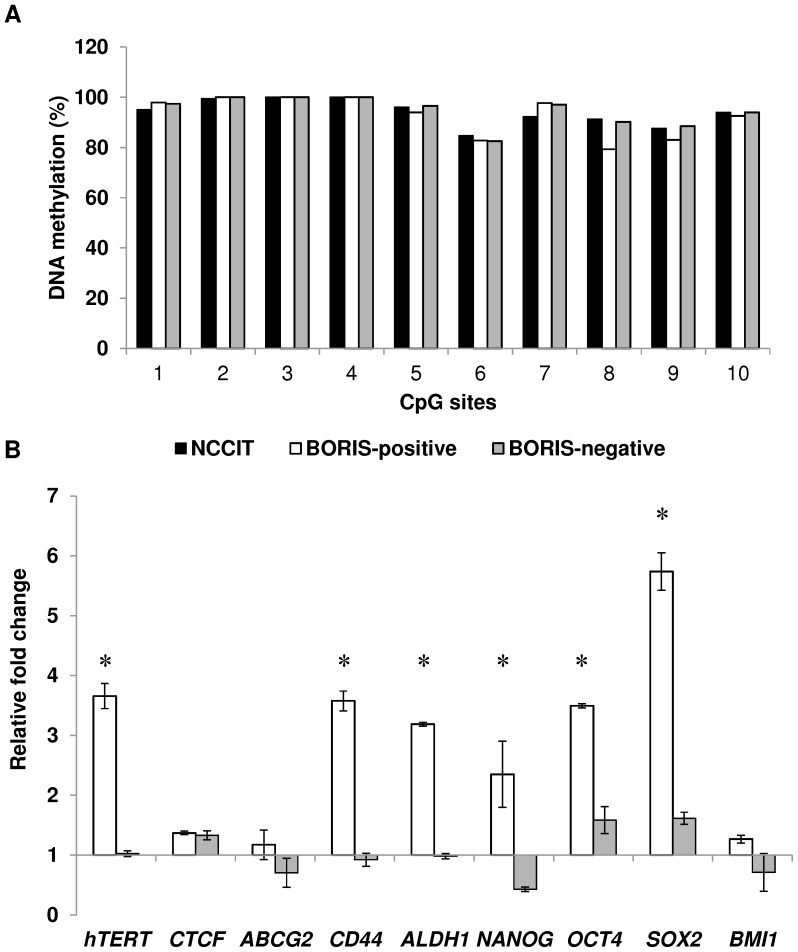
Figure 3. BORIS promoter methylation and expression of hTERT, stem cell and CSC markers genes in BORIS-positive cells.
(A) Methylation analysis of 10 CpG islands within the BORIS promoter region (B promoter). The representative graphic shows the percentage of methylation of each CpG island for the isolated BORIS-positive (white), -negative (grey) and non-sorted (black) NCCIT cells. (B) Expression analysis of the isolated BORIS-positive (white) and BORIS-negative (grey) fractions. The indicated genes were analyzed by qRT-PCR. The results were normalized to GAPDH and related to non-sorted NCCIT cells. Graphic shown one representative experiment out of 3 independent experiments (the trend was similar in all independent experiments). Asterisks indicate statistically significant difference (p<0.05) between BORIS-positive and the non-sorted cells.

