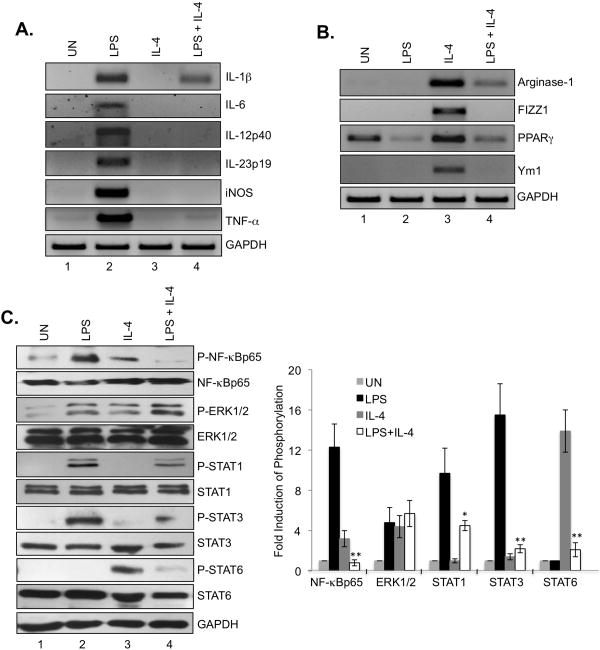
Figure 2. Plasticity of M1 and M2 Macrophage Phenotype Upon LPS and IL-4 Stimulation.
(A). BMDMs were cultured with M-CSF (10 ng/ml) for 5 days, treated with LPS, IL-4 or LPS plus IL-4 for 4 h, and then mRNA analyzed by RT-PCR for IL-1β, IL-6, IL-12p40, IL-23p19, iNOS, TNF-α and GAPDH expression. (B). BMDMs were cultured with M-CSF (10 ng/ml) for 5 days, treated with LPS, IL-4 or LPS plus IL-4 for 4 h, and then mRNA analyzed by RT-PCR for Arginase-1, FIZZ1, PPAR-γ, Ym1 and GAPDH expression. (C). BMDMs were cultured with M-CSF (10 ng/ml) for 5 days, treated with LPS, IL-4 or LPS plus IL-4 for 4 h, and then protein lysates analyzed by immunoblotting with the specified antibodies. The densitometric quantification of P-NF-κBp65, P-ERK1/ERK2, P-STAT1, P-STAT3 and P-STAT6 was determined using an image analysis program (ImageJ 1.41oh) by comparing to untreated samples. *p<0.05; **p<0.001. Represents three independent experiments.

