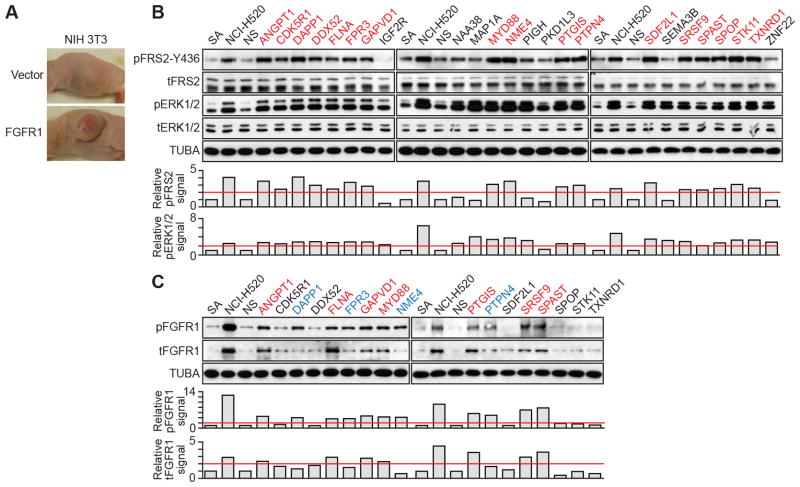
Figure 3.
Many of the TSGs encode repressors of FGFR signaling. A, Tumor formation 4 weeks following injection of NIH 3T3 cells expressing FGFR1 or, as a control, empty vector. B and C, (Top) Immunoblots monitoring phosphorylated (p) and total (t) FRS2 and ERK1/2 (B) or FGFR1 (C) in the SA knockdown cell lines and NCI-H520 cells. α-tubulin (TUBA) was monitored as a loading control. (Bottom) Quantification of the immunoblots. The red line indicates a two-fold increase in phospho-protein level relative to that observed in non-silencing (NS) cells, which was set to 1. Genes in red indicate those whose knockdown increases pFRS2-Y436 levels (B) or pFGFR1 and tFGFR1 levels (C); blue, increased pFGFR1 but not tFGFR1 levels; and black, no effect on either pFGFR1 or tFGFR1 levels.

