Figure 5.
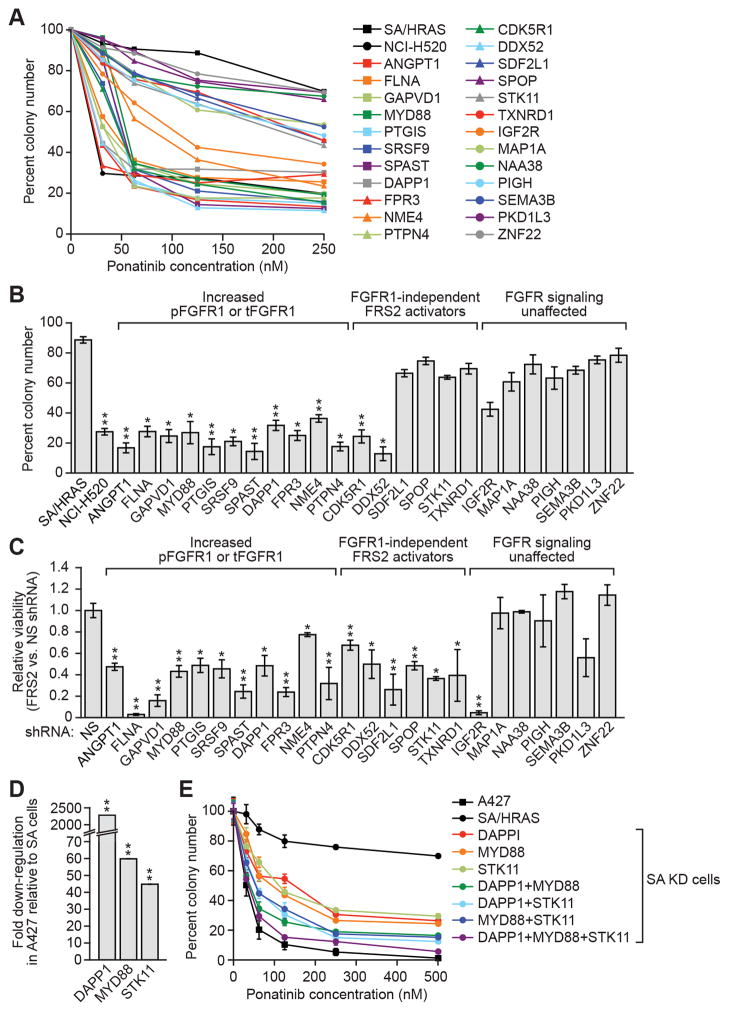
Knockdown of FGFR signaling repressors sensitizes HBECs to FGFR pharmacological inhibition. A, Soft agar assay measuring colony formation of SA knockdown cells treated with varying concentrations of ponatinib. Colony number was normalized to that obtained in the absence of ponatinib, which was set to 100%. B, Soft agar assay measuring colony formation of SA knockdown cells treated with 125 nM ponatinib, normalized as described in (A). Data are represented as mean ± SD. C, Colony formation assay measuring viability of SA knockdown cells expressing an FRS2 shRNA relative to that obtained with a non-silencing (NS) shRNA. Viability was normalized to that obtained in NS shRNA-expressing cells, which was set to 1. Data are represented as mean ± SD. D, qRT-PCR analysis monitoring expression of DAPP1, MYD88 and STK11 in A427 cells relative to SA cells. Data are represented as mean ± SD (error bars are too small to be visualized). E, Soft agar assay monitoring colony formation of ponatinib-treated SA single, double and triple knockdown (KD) cells, normalized as described in (A). Data are represented as mean ± SD. *P<0.05; **P<0.01.

