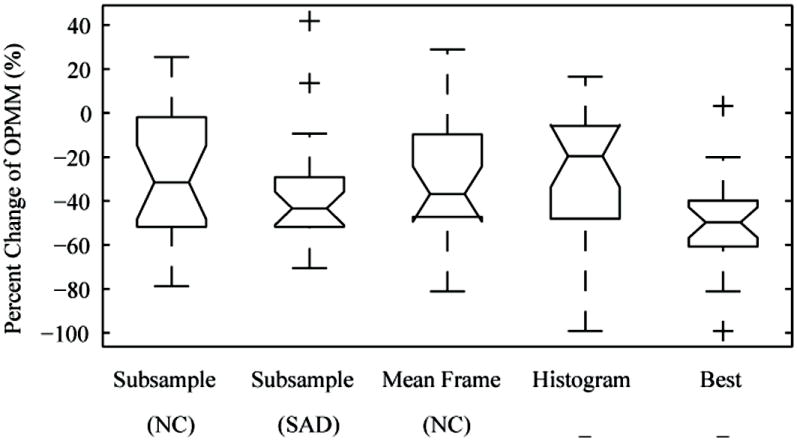
Figure 9.

Percent change of the out-of-plane motion metric (OPMM) pre- and post- out-of-plane motion filtering on all 22 FLL contrast mode cines (more negative is better). By trying all methods and choosing the best performing filter, the OPMM was substantially reduced in almost all cines. In this figure, the middle of the box is the median, the top/bottom of the box are the 1st and 3rd quartiles, the whiskers show the range excluding outliers, and the markers indicate possible outliers. Note that while the Histogram method had the worst median performance, it had the best performance in a few cases due to the large standard deviation.
