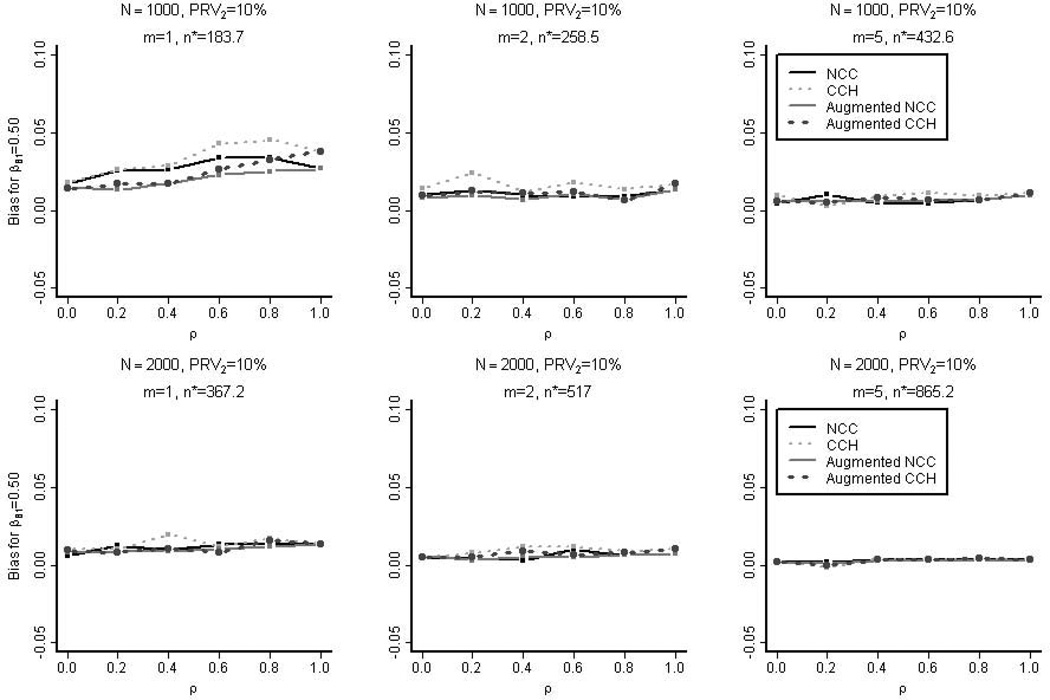
Figure 2. The Empirical Bias in the Simulation Studies.
The empirical bias in estimating βB,1=0.5 for the four designs is shown: nested case-control (NCC), case-cohort (CCH), augmented nested case-control, and augmented case-cohort. These samples were selected from the full cohorts with 10% prevalence of the secondary outcome (PRV2). n* is the average overall size of the un-augmented nested case-control samples.

