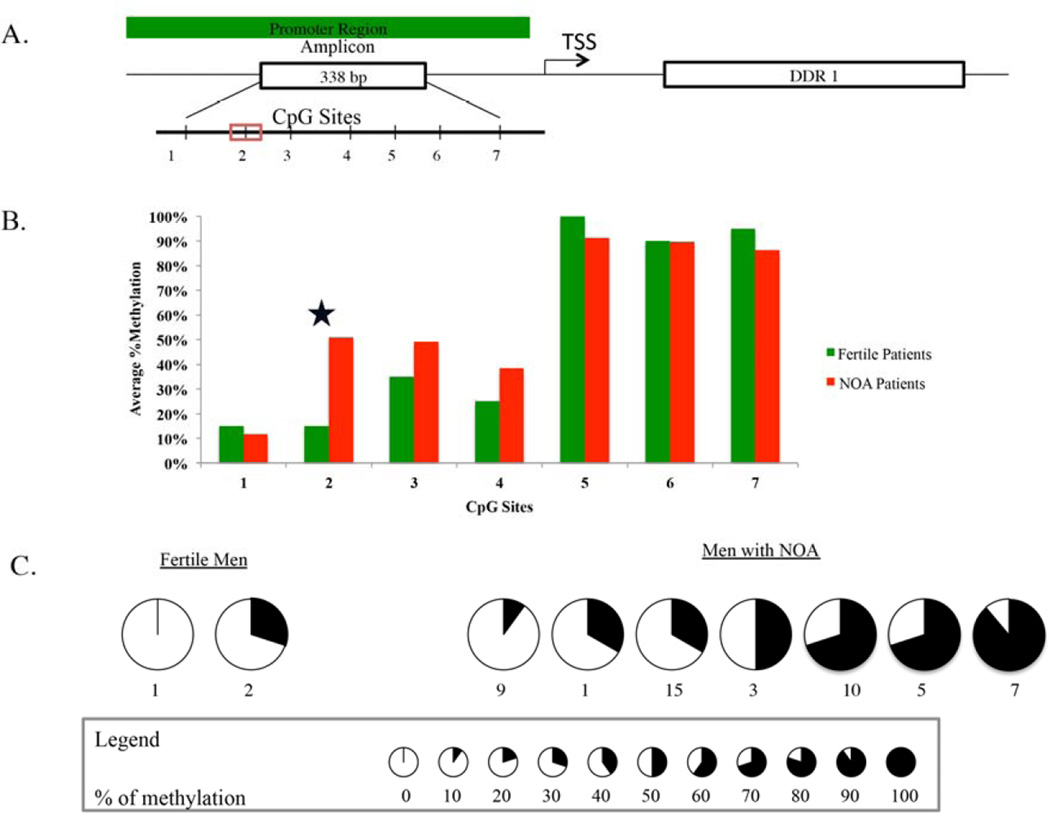
Figure 2.
Map of the 338-bp CpG island around exon 1 in DDR1. Vertical bars indicate CpG sites (A). Clonal bisulfite sequencing was done to assess methylation status of CpG sites in the amplicon (B) and site # 2 (cg13329862) in men with NOA and fertile controls (c). Ten clones were sequenced from each patient. The percentage of methylation in each CCG site is denoted by pie charts, as indicated.

