
Figure 3.
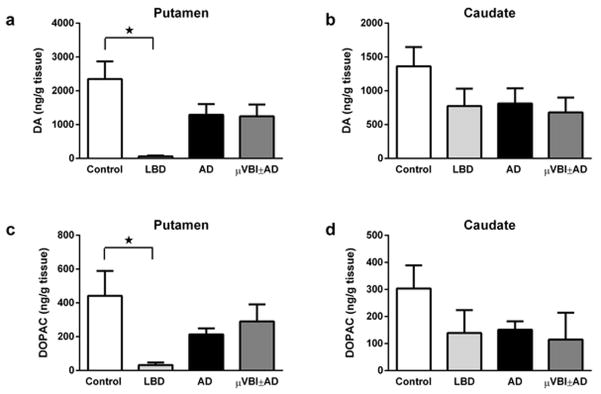
Catecholamine levels in post-mortem human striatum from control (n = 5), LBD (n = 5), AD (n = 11) and μVBI±AD (n = 3) groups, measured by HPLC and normalized to tissue weight. (a) DA in Putamen. (b) DA in the caudate nucleus. (c) DOPAC in Putamen. D. DOPAC in the caudate nucleus. All data is presented as mean ± SEM. * p < 0.05. Significant pairwise comparisons of groups are indicated by brackets.