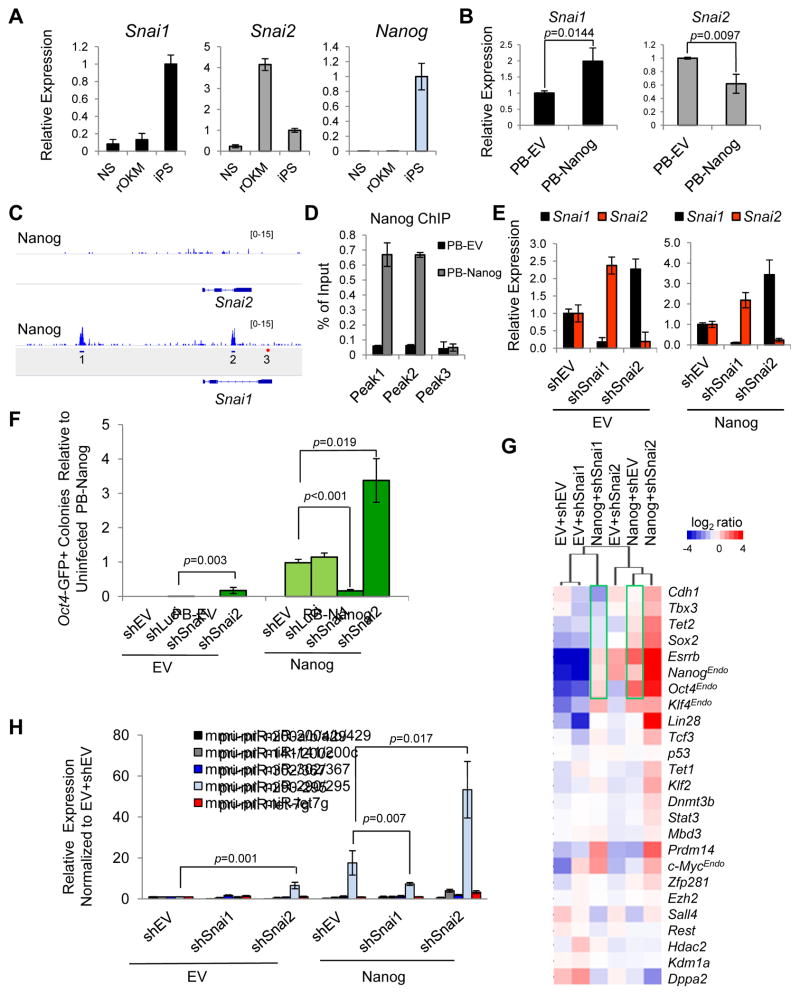
Figure 2. Opposing Effects of Snai1 and Snai2 Depletion on pre-iPSC reprogramming.
(A) Relative expression levels of Snai1, Snai2, and Nanog in NS, rOKM, and iPSC cells.
(B) Ectopic expression of Nanog upregulates Snai1 and downregulates Snai2 in rOKM pre-iPSCs. Error bars indicate average ± SD (n=3). p values were calculated with the unpaired t-test.
(C) Nanog binding peaks are found on the Snai1, but not Snai2 locus (Marson et al., 2008). Amplicons 1 and 2 are at the Nanog-bound Snai1 locus. Amplicon 3 is a negative control.
(D) ChIP-qPCR validation of Nanog binding to the Snai1 locus. Amplicons are noted in Figure 2C.
(E) Mutually repressive expression of Snai1 and Snai2 in pre-iPSCs measured by qRT-PCR. Data are normalized to empty vector (shEV) and Gapdh. Error bars indicate average ± SD of two independent shRNAs each against Snai1 and Snai2 (n=3).
(F) Opposing effects of shSnai1 and shSnai2 on Nanog-dependent pre-iPSC reprogramming. Error bars indicate average ± SD (n=3) using two independent shRNAs against each Snai1 and Snai2. p values were calculated with the unpaired t-test.
(G) Relative expression of pluripotency genes measured by qRT-PCR in clonal pre-iPSCs cultured in serum+LIF at day 0 (before the medium switch).
(H) Relative expression of primary miR transcripts (pri-miRs) measured by qRT-PCR in pre-iPSCs transduced with indicated shRNAs against Snai1 and Snai2 under serum+LIF conditions. Values are normalized to Gapdh and snU6 for each condition. Error bars indicate average ± SD (n=3) using two independent shRNAs each against Snai1 and Snai2. p values were calculated with the unpaired t-test. See also Figure S2.

