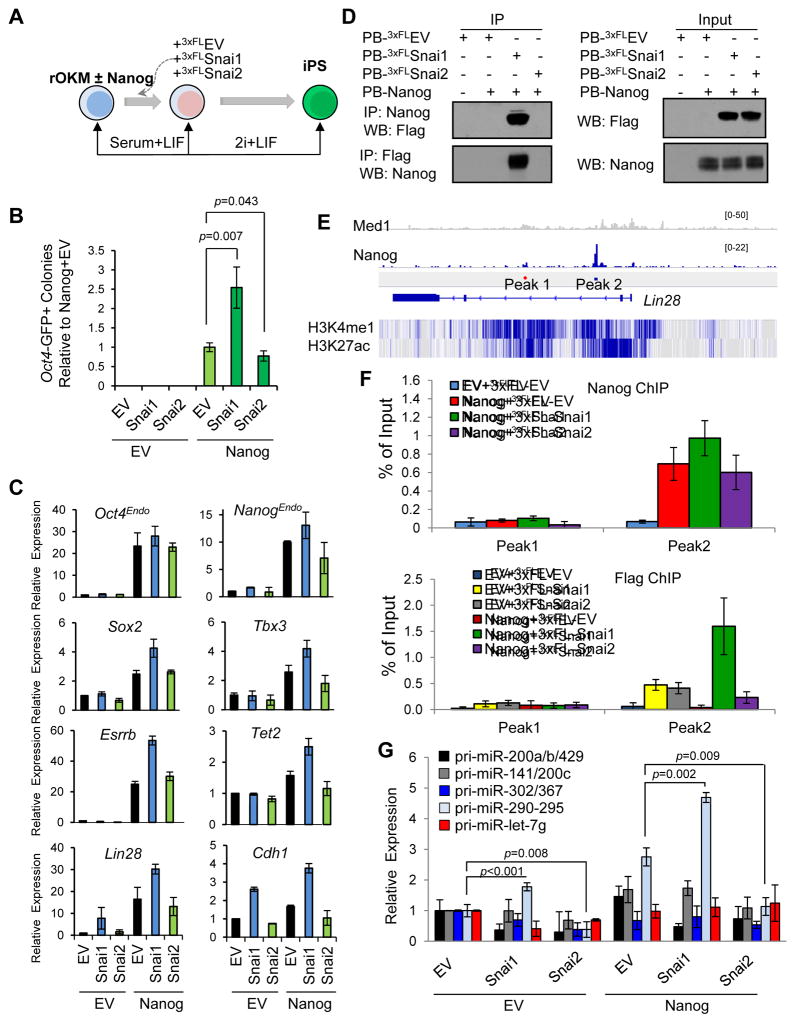
Figure 3. Ectopic Snai1 and Snai2 Have Opposite Effects on Nanog-Dependent pre-iPSC reprogramming.
(A) Reprogramming assay overview.
(B) Relative reprogramming efficiencies from the data shown in Figure S3B (presented as average ± SD (n=6)). p values were calculated with the unpaired t-test.
(C) Relative expression of pluripotency genes measured by qRT-PCR in clonal pre-iPSCs cultured in serum+LIF. Error bars indicate average ± SD (n=3).
(D) Snai1, but not Snai2, physically interacts with Nanog in pre-iPSCs.
(E) Depiction of Nanog binding peaks at the Lin28 locus. Peak 1 is a negative control. H3K4 mono methylation and H3K27 acetylation patterns are displayed below in blue.
(F) Cooperative binding of Nanog and Snai1 to the Lin28 locus. Data are from two independent ChIP experiments and presented as average ± SD (n=2).
(G) Relative expression of primary miR transcripts (pri-miRs) measured by qRT-PCR in pre-iPSCs transduced with Snai1 and Snai2 under serum+LIF conditions (normalized to Gapdh and snU6 for each condition). Error bars indicate average ± SD (n=3). p values were calculated with the unpaired t-test. See also Figure S3.

