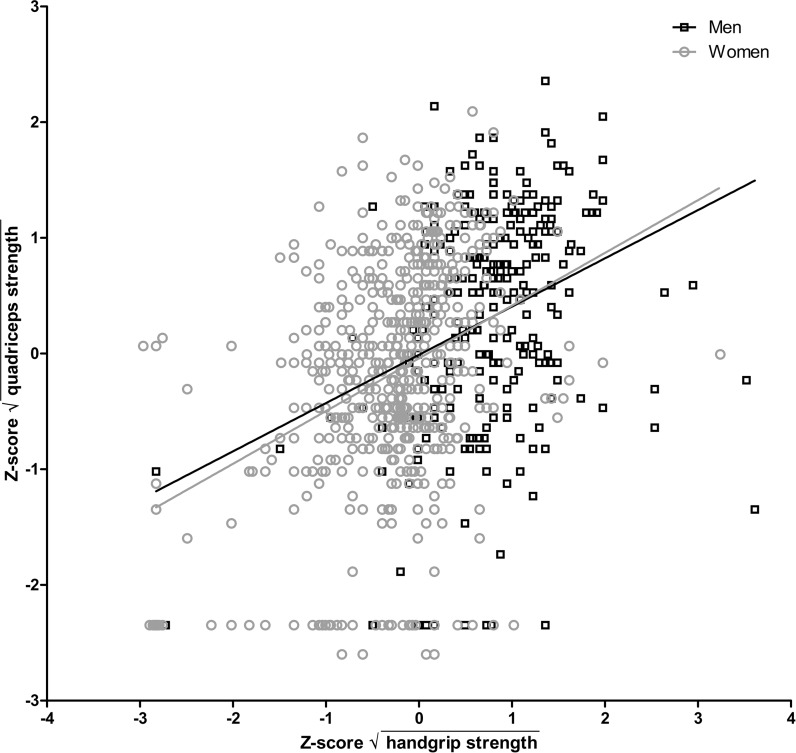
Fig. 1.
Scatter plot showing the relationship between the handgrip strength and the quadriceps strength. Regression lines are marked separately for men and women. Handgrip and quadriceps strength measurements were normalized using square root transformation followed by standardization into Z scores. Correlation estimates for men (adjusted for age): R 2 = 0.12, β = 0.34 (95 % CI 0.18–0.51); women (adjusted for age): R 2 = 0.14, β = 0.44 (95 % CI 0.34–0.55)

