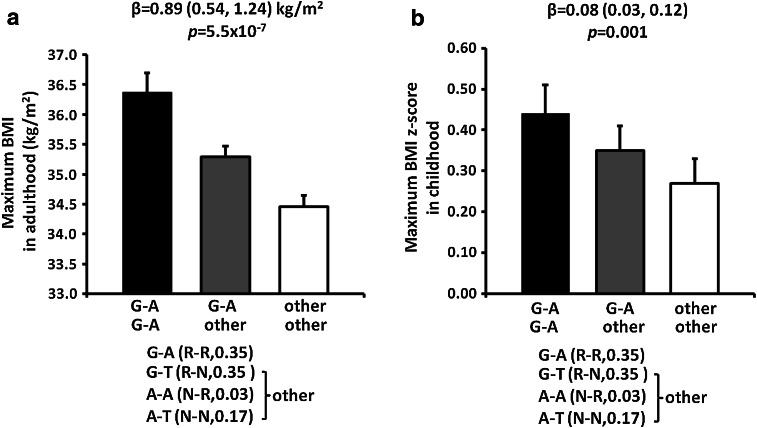
Fig. 2.
Haplotype effects of rs74861148 and rs483154 on maximum BMI in American Indian adults (a) and maximum BMI z score in children (b). Haplotype frequency is indicated in the parenthesis. Adult BMI and BMI z score are presented as an adjusted mean ± SE for each haplotype group. β represents the effect per copy of the risk haplotype. p values (additive model) and β (95 % CI) were adjusted for age, sex, birth year and heritage

