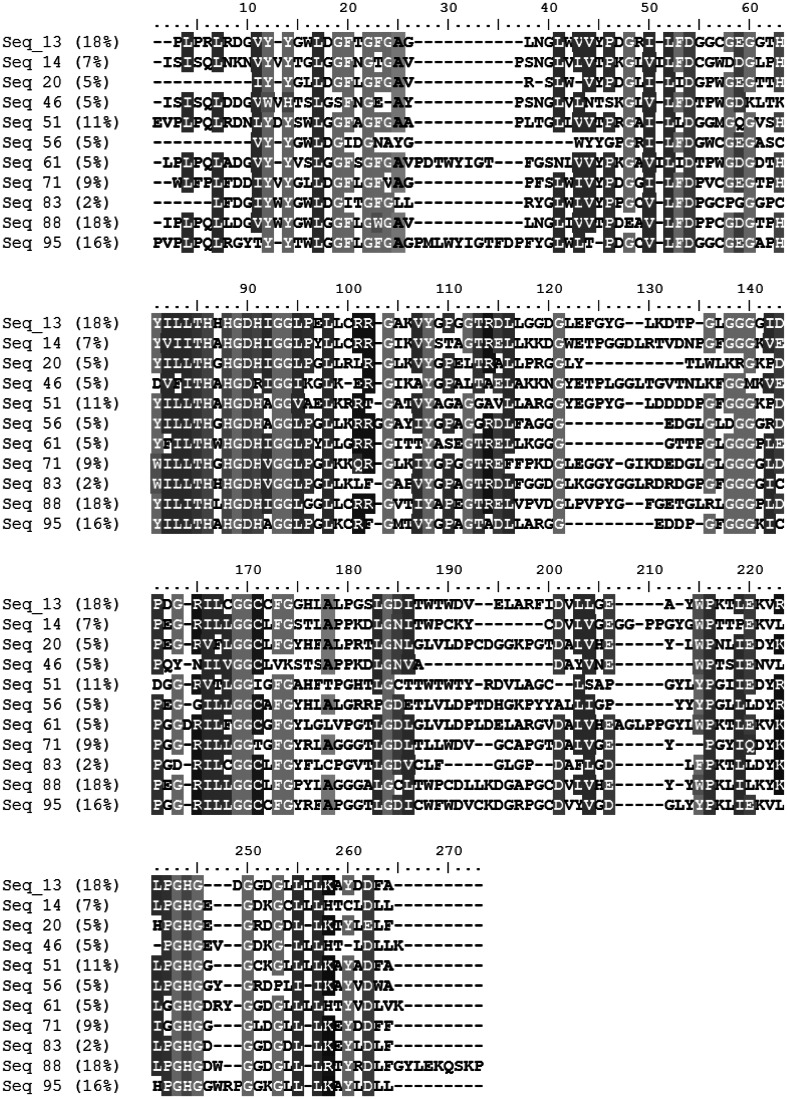
Fig. 3.
Representative sequences from each of the 11 clusters with weightings. Sequence alignment of each representative from each cluster, aligned with default settings in MAFFT. Each percentage value represents the weight of the cluster from the 44 MRCA sequences with IPR001018 signatures. Columns are coloured at a 70 % similarity threshold. The sequence alignment was visualised in BioEdit (Hall 1999)

